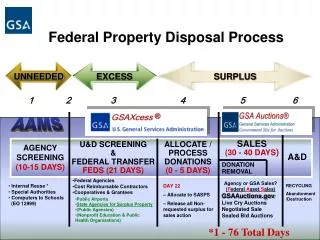
Download
1 / 36
360 likes | 555 Views
Excess Noise Properties of GaN Nanowires. Presented by Liang-Chen Li 2006/12/22. 2. Introduction. Random process [1] : For a stationary random process X(t) : Cross spectrum : For two signals X(t) and Y(t):. 3. Introduction. 1/ f Noise:

E N D
Excess Noise Properties of GaN Nanowires Presented by Liang-Chen Li 2006/12/22
2 Introduction • Random process[1]: For a stationary random process X(t): • Cross spectrum : For two signals X(t) and Y(t):
3 Introduction • 1/f Noise: The power spectrum density of the fluctuation varies inversely as frequency.[2] For semiconductors, the 1/f noise may arise due to the relaxation of the defects or the dynamics of groups of defects in a finite relaxation time.[3] • Lorentzian Noise: The Lorentzian noise is also known as “Burst noise”. [2] When the kinetics of the fluctuation is characterized by a single relaxation time, the spectral density is a Lorentzian function of frequency.[4]
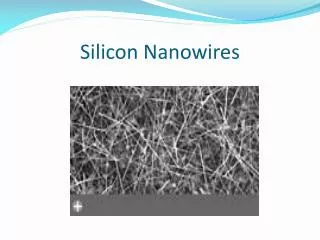
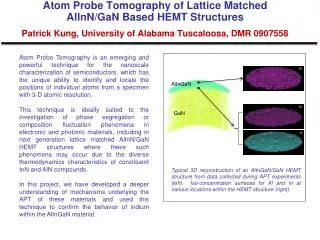
4 Sample -- Growth • The nanowires are grown by the Vapor-Liquid-Solid (VLS)process.[5] • In the quartz tube: Molten Ga + Catalyst:Au • From room temperature to the reaction temperature, 910 ℃: at a rate of 50 ℃ / min. • Kept constant for about 12 hours with the ammonia flow rate at 18 sccm. • Grown GaN nanowires are collected in the catalyst substrate. SEM image of GaN nanowires. The diameter of the wire is 80.3 nm. (This image was provided by Mr. L. T. Liu from the laboratory of Prof. C. C. Chen in the Department of Chemistry, National Taiwan Normal University.)
5 Sample -- Fabrication • Al, Al/Ti, or Ti/Au electrodes of the nanowires are defined by the e-beam lithography. • SEM image is the sample J.
Sample Resistance (W) dw A 4.0k 45nm B 8.8k 160nm C 11.2 k 72nm D 17.7k 76nm E 15.6k 80nm F 23.4k 127nm G 26.2k 133nm H 28.4k 150nm I 34.4k 137nm J 44.3 k 144nm 6 Sample -- Electrical properties • Two-wire I-V plots of the sample I at room temperature. The contacts of the wire are ohmic. Table of resistance and diameter of the sample
7 Instrumentation and measurement methods -- Instrument specification • The specification of our instruments: 1.Homemade JFET-input ultra low-noise voltage preamplifier[6]: Noise: (with very high Input impedance) If the cross spectrum technique is used, the noise will be down to 2.SR560 Low-noise preamplifier: Noise 3.SR780 Spectrum Analyzer: Frequency range : 1 mHz ~ 102.4 kHz Noise
8 Instrumentation and measurement methods -- Spectrum of homemade preamplifier
9 Instrumentation and measurement methods -- direct FFT measurement • We use a balanced circuit to measure the noise of an GaN nanowire. In the direct FFT measurement, the amplified signal from the sample is fed into the FFT dynamic signal analyzer. SR780 measures the power spectrum density directly.
10 Instrumentation and measurement methods -- Cross-spectrum technique • We use a balanced circuit to measure the noise of an GaN nanowire. In the direct FFT measurement, the amplified signal from the sample is fed into the FFT dynamic signal analyzer. SR780 measures the power spectrum density directly.
11 Instrumentation and measurement methods -- Time domain sampling • We use a balanced circuit to measure the noise of an GaN nanowire. In the
12 1/f Noise -- Introduction where Ntot is the number of the mobile carriers, g= 2 × 10⁻³, and a = 1. • Hooge’s phenomenal equation [7]: • Simplified equation[8]: • Fitting equation of our experiment: Where A is the noise amplitude. Where Sthemal is the background thermal noise of samples.
13 1/f Noise --Experiments of carbon nanotubes • Collins et al (2000):[8] • Experiment of the 1/f noiseof singlewalled carbon nanotubes (SWCNTs). • A=10-11R and a=1~1.1 • SV of the GaN nanowire is smaller than that of SWCNTs with similar resistance at the same bias current. • Ouacha et al (2002)[9]: • Experiment of the 1/f noiseof multiwalled carbon nanotubes (MWCNTs) • An individual MWCNT: a =1.02. • Tow crossing MWCNT: a=1.56. Spectrum of the work of collins et al (2000)[8]
14 Results-- Spectrum of a two-wire sample • The 1/f excess noise raises up when the current through the GaN-nanowire increases. The red straight line in the plot is the background thermal noise (4kTR).
15 Results-- a versus bias currents • The scattering range of a is between 0.87 to 1.3. The orange line is a=1.11 ± 0.09 in average
16 Results-- Noise amplitude versus bias current • The noise magnitude is around the same value for each individual nanowire.
17 Results-- a and Noise amplitude versus resistances • a and the noise amplitude, A versus resistance of the GaN nanowires. a = 1.11 ± 0.09 for different samples.
18 Results-- Corner Frequency of Samples • The slope of the corner frequency (fc) vs the current in logarithmic scale is close to 2. fc is not clearly related to resistances.
19 Results-- Spectrum of a four-wire sample • Spectrum of a four-wire a sample with R4W=1.53 kW, and R2W= 32.60 kW. The contact resistance of the two voltage probes is 6.58kW and 26.13 kW, respectively
20 Lorentzian noise-- Introduction • Lorentzian noise expression:[10] where SV(0) is the Lorentzian plateau . f0 is the characteristic frequency. Lorentzian time constant tL=(2pf0)-1.
21 Lorentzian noise-- Experiments of diodes and transistor • Deen et al (1999)[11]: • The noise measurement of polysilicon emitter bipolar transistors . • From 8 Hz to 10 kHz, there exists Lorentzian feature. • Bychikhin et al (2005) [12] : • The noise measurements of GaN-based light-emitting diodes. • From 10 Hz to 100 Hz, there exists Lorentzian feature. • Rumyantsev et al (2004) [13] : • Fluctuations of ligh sources of LEDs and laser diodes. • For f<1 Hz, there exists Lorentzian feature. Spectrum of the work of Deen et al (1999)[11]
22 Results-- Lorentzian noise of a two-wire sample • Two-wire power spectrum density of GaN nanowire with different bias current I at room temperature. The Lorentzian feature are observed at the large enough driving current.
23 Results-- Lorentzian noise of a four-wire sample • Spectrum of a sample with R4W= 230 W, and R2W = 1.2 kW at 303 K at I=7nA.The resistances of the two voltage probes are 3.1 kW and 14.1 kW, respectively.
24 T-dependence of Lorentzian Noise-- Introduction where Eais the activation energy, and n0 is an attempt frequency which is in the order of the atomic vibration frequency. • Arrhenius law[4]: • Model of Levinshtein et al[14]: wheres is the cross section, n0 is the carrier concentration, tcis the capturing characteristic time, and uTis the thermal velocity.
25 T-dependence of Lorentzian Noise -- Experiments of semiconductor material • Muller et al (2006)[15]: • The 1/f noise measurement of AlGaAs/GaAs Hall device . • Below 50 K, there exists Lorentzian feature. • From Arrhenius plot, Ea = 88 meV, n0 = 6 × 10⁹ Hz • Model of Levinshtein et al[16]: • The 1/f noise measurement of GaNÕAlGaN heterostructure field-effect transistors • From 150 K to 50 K, there exists Lorentzian feature. • From Arrhenius plot, Ea = 1~3meV, Arrhenius plot of Muller et al (2006)[15]
26 Results-- Lorentzian noise below room temperature • Spectrum of a two-wire GaN nanowire device at 175 K with 58 kW.
27 Results-- Temperature dependence of SI(0)/I2 • SI(0)/I2 vs temerature. At the same temperature, SI(0)/I2 is around the same order of magnitude relative with the current I.
28 Results-- SI(0)/I2versus tL • SI(0)/I2 versus the characteristic time tL for the different bias currents.
29 Results-- T-dependence of a four-wire device • Temperature dependence of the characteristic time and SI(0)/I2 at I=7nA.
30 Results-- Activation energy of the two-wire device • Activation energy versus the bias current. The activation energy at the high temperature regime is larger than that at the low temperature regime.
31 Results-- Activation energy of the four-wire device • From Arrhenius plot: Ea= 41.69 meV. • From the model of Levinstein et al[2], E0= 37.7 meV and E1= 41.69 meV. • For nanowires, it is close to the ionization energy, 30 meV[2] of the wutzite GaN bulk material.
32 Results-- Contact noise • Averaged cross spectrum between the port 12 and port 23.
33 Results-- Correlation Coefficient • Averaged Cf under different applied bias current versus frequency f. The error bars indicate the size of the 95% confidence band.
34 Conclusion • So far, there is no experimental investigation about semiconductor nanowires. • GaN nanowires exhibit the 1/f-like excess noise from room temperature to 77 K in the frequency below 200 Hz. • Lorentzian-like feature is observed embedded in the 1/f noise when the applied bias current is large enough. • From the results of two-wire and four-wire measurement, the GaN nanowire do exhibit the excess noise itself, but the excess noise of the two-wire measurement come from the metal-semiconductor contact region rather than from the nanowires directly. • The nanoscale correlation might be caused by the strong voltage fluctuations under the contact region, which may contain complicated alloy or defects consisting of GaN and the Al or Ti/Au. • GaN nanowires is with lower 1/f noise in the lower frequency region than carbon nanotubes. It makes GaN nanowires a potential material for nanodevices, such as photo-detector, sensor and low frequency transistors.
35 References • A. Van der Ziel. Noise: Source, Characterization, Measurements. Prentice Hall Inc., Englewood Cliffs, NJ, (1970). • D. A. Bell, Noise and the solid state, Pentech Press Ltd., Devon, UK, (1985). • P. Dutta and P. M. Horn, Rev. Mod. Phys. 53, 497 (1981). • Sh. Kogan, Electronic noise and fluctuations in solids, Cambridge university press, Cambridge, UK (1996) • C.C.Chen, C.C.Yeh, C.H.Chen, M.Y.Yu, H.L.Liu, J.J.Wu, K.H.Chen, J.Y.Peng, Y.F.Chen, J. Am. Chem. Soc. 123, 2791. (2001) • W. K. Wang, The noise measurement with the homemade low-noise preamplifiers, B.S Thesis, National Chung Hsing University (2001) • Hooge, Phys. Lett. A 29, 139 (1969). • P. G. Collins, M. S. Fuhrer, and A. Zettl, Appl. Phys. Lett. 76, 894 (2000). • H. Ouacha, M. Willander, H. Y. Yu, Y. W. Park, M. S. Kabir, S. H. Magnus Persson, L. B. Kish, and A. Ouacha, Appl. Phys. Lett. 80, 1055 (2002). • N. B. Lukyanchikova, M. V. Petrichuk, N. P. Garbar, A. Mercha, E. Simoen, and C. Claeys, J. Appl. Phys. 94, 4461 (2003).
36 References • M. J. Deen, S. L. Rumyantsev, and M. Schroter. J. Appl. Phys., 85, 1192, (1999). • S. Bychikhin, D. Pogany, L. K. J. Vandamme, G. Meneghesso, and E. Zanoni. J. Appl. Phys., 97, 123714, (2005). • S. L. Rumyantsev, M. S. Shur, Yu. Bilenko, P. V. Kosterin, and B. M. Salzberg. J. Appl. Phys., 96, 966, (2004). • M. E. Levinshtein and S. L. Rumyantsev. Semicond. Sci. Technol., 9, 1183, (1994). • J. Muller, S. von Molnar, Y. Ohno, and H. Ohno. Phys. Rev. Lett., 96, 186601, (2006). • S. L. Rumyantsev, Y. Deng, E. Borovitskaya, A. Dmitriev, W. Knap, N. Pala, M. S. Shur, M. E. Levinshtein, M. Asif Khan, G. Simin, J. Yang, and X. Hu. J. Appl. Phys., 92, 4726, (2002).