Download
1 / 14
140 likes | 322 Views
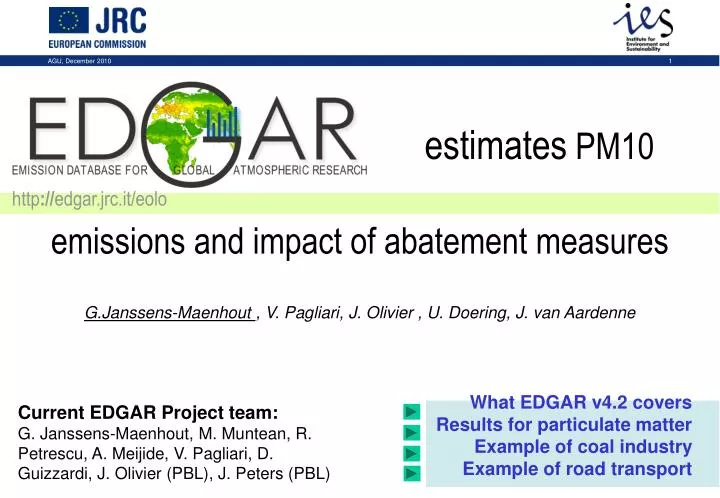
estimates PM10 . http :// edgar.jrc.it/eolo. emissions and impact of abatement measures. G.Janssens-Maenhout , V. Pagliari, J. Olivier , U. Doering, J. van Aardenne. What EDGAR v4.2 covers Results for particulate matter Example of coal industry Example of road transport.

E N D
estimates PM10 http://edgar.jrc.it/eolo emissions and impact of abatement measures G.Janssens-Maenhout , V. Pagliari, J. Olivier , U. Doering, J. van Aardenne What EDGAR v4.2 covers Results for particulate matter Example of coal industry Example of road transport Current EDGAR Project team: G. Janssens-Maenhout, M. Muntean, R. Petrescu, A. Meijide, V. Pagliari, D. Guizzardi, J. Olivier (PBL), J. Peters (PBL)
What EDGAR covers, are global anthropogenic emissions • Time periods: • 1970 – 2008 historical annual emissions (some also monthly) • 2005 - 2050 scenarios with POLES/ IMAGE growth rates • Chemical substances: • Direct greenhouse gases: CO2 CH4 N2O HFCs PFCs SF6 • Ozone depleting substances: CFCs HCFCs • Air pollutants: CO NOx NMVOC SO2 NH3 PM10PM2.5 BC • Spatial allocation: • Activity & emission data on 0.1° x 0.1° grid cells using grid maps for urban/rural population density, animal density, power/industrial plants, coal mines, oil/gas fields, road network, shipping/aircraft routes, rice fields, crop/grass lands EOLO datasets v4.1 since August 2010 on line: http://edgar.jrc.ec.europa.eu
EDGARv4 database structure Activity DataIEA, USGS, FAO, UN Com. St., FRA … Emission Factors IPCC, Corinair, AP42, sc. mod. TECHnology& EOP data EOP reductions Techn. ActivityData Red.Emission Factors EMISSIONS kton/yr EmissionsGRIDs 0.1°x0.1° Grid maps 0.1°x0.1° scale EMISSIONS on grids
Results for Air Pollutants:the example of PM10 • Comparison of global PM10 with • HTAP compilation (EMEP+GAINS+REAS, gapfilled with EDGAR) • 2) IIASA global estimate EDGARv4 versus EMEP for Germany EDGARv4 versus GAINS for China.
Discussion of Particulate Matter:evaluation by intercomparisons Sectoral details for PM emissions in EDGAR v4: Comparison with PM10 reported 2005 EMEP emissions (N02 of 2010) yields satisfying results (taking into account large uncertainty for biofuels, diffusive emission sources,…) … and no diffusive sources … and no diffusive sources …because EDGAR does not include superemitters treatment
Example of control measures in road transport Where do PM emission differences in road transport come from ?comparison of EF/EOP with T. Bond (2007, 2004): Similar EF for diesel and petrol But EDGARv4.1 opted for no “superemitters” A 10% share emitting 10x as much implies 2x total emissions
Comparison of sectoral PM10 emissions for selected countries in 2005 between EDGARv4 and HTAP v1 (i.e. EMEP/EEA data for countries of the EMEP domain, REAS data for Japan & India, GAINS data for China) PM10 emissions do not include: abrasive emissions in road transport and construction (two significant diffusive emission sources), because many countries do not report these, and there is presently no unique scientific methodology to estimate these emissions worldwide.
Example of abatement in energy industry: Coal fired plants TJ/yr TJ/yr Germany China Coal in electricity generation is still major cause of world PM10
Example of control measures in road transport: Passenger cars TJ/yr TJ/yr Diesel passenger cars Petrol passenger cars -20% To be checked
-20% BC from global road transport (busses, LDV, HDV, passenger cars, two-wheelers) shows the same reduction percentage as PM10 -35% In EU-27 a stronger reduction is observed in the trend from the 1990s onwards
Example of control measures in road transport All Reference case ton PM10/cell Difference: EU1 – All Difference: EU3 – All
Example of control measures in road transport World-wide impact of implementing EU control measures beyond EU1 & EU3: 40% extra gain scenario1: EU1 stagnation scenario 2: EU3 stagnation Reference scenario: all EU control measures By 2000 much of the world was effectively meeting “Euro3”
Conclusion and Outlook Releases: Greenhouse Gases: available on edgar.jrc.ec.europa.eu under v4.0 of July 2009 and updated in v4.1 of August 2010 Air Pollutants: available on edgar.jrc.ec.europa.eu under v4.1 of August 2010 PM10 and update to 2008: final checks ongoing, release soon Further upgrade EDGARv4 ongoing: PM2.5, BC/OC, completion of LULUCF, region-specific technology mixes, technology-specific gridmaps EDGAR is a tool to analyse consistently throughout the world impacts of technologies with related emission standards thanks you for attention/feedback