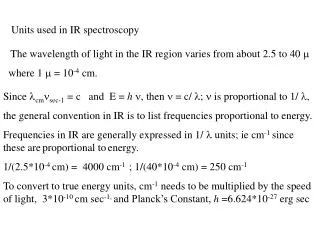
Download
1 / 8
100 likes | 351 Views
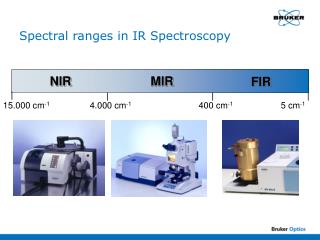
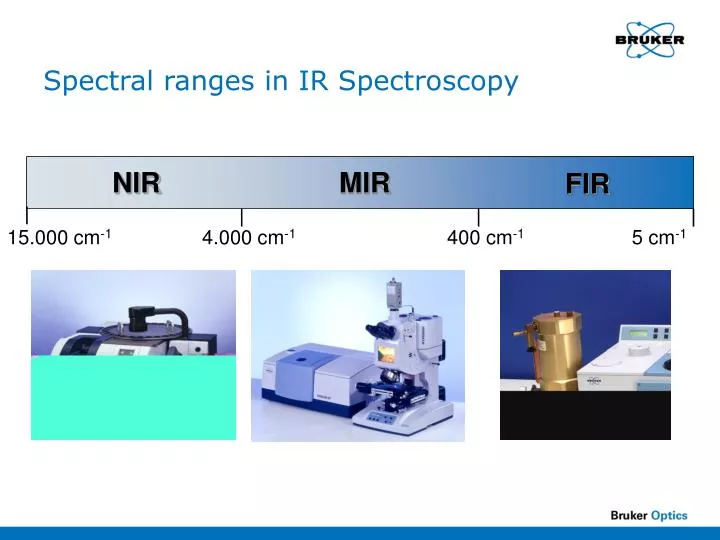
Spectral ranges in IR Spectroscopy . NIR. MIR. FIR. 15.000 cm -1. 4.000 cm -1. 400 cm -1. 5 cm -1. What is IR-spectroscopy?. Interaction of light and matter. Excitation of vibrations. Types of vibrations example: water. stretching vibrations:. deformation vibration.

E N D
Spectral ranges in IR Spectroscopy NIR MIR FIR 15.000 cm-1 4.000 cm-1 400 cm-1 5 cm-1
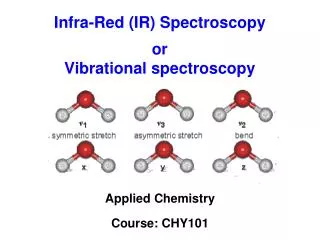
What is IR-spectroscopy? • Interaction of light and matter Excitation of vibrations
Types of vibrations example: water stretching vibrations: deformation vibration symmetric stretching vibrations anti symmetric stretching vibrations
Principle of NIR spectroscopy • Excitation of vibrations • Overtone bands • Combination bands • Evaluation of OH, CH, NH functional groups • Requires comparison against known data (Quantification or qualification models)
Spectra of water 5 MIR / NIR Fundamental stretching 4 3 Extinction Fundamental bending Combination 2 1st overtone 1 0 9000 8000 7000 6000 5000 4000 3000 2000 1000 Wavenumber (cm-1)
NIR Spectra • Contain information on the physical form of the material and its chemical structure. Particle size and density difference will be seen as baseline offsets. • Contains broad, overlapping absorbance bands from multiple components and/or functional groups
Analysis values Reference values NIR Evaluation of spectra • Requires comparison against known data • Qualification:comparison against a set of spectra of known good quality“IDENT methods” • Quantification:using spectral information of samples of known concentrations to predict concentrations of new unknown samples. PLS is used for this type of evaluation.