Download
1 / 1
10 likes | 99 Views
Original Mauna Loa Building. Data Products. Carbon Tracker. Global Methane. Greenhouse Gases Hold Solar Energy.

E N D
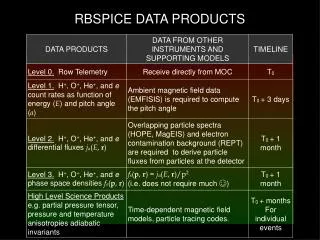
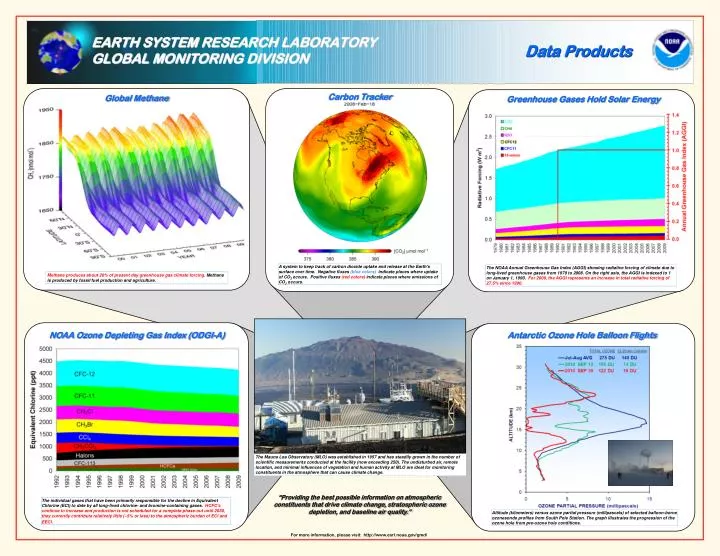
Original Mauna Loa Building Data Products Carbon Tracker Global Methane Greenhouse Gases Hold Solar Energy A system to keep track of carbon dioxide uptake and release at the Earth's surface over time. Negative fluxes (blue colors) indicate places where uptake of CO2 occurs. Positive fluxes (red colors) indicate places where emissions of CO2occurs. The NOAA Annual Greenhouse Gas Index (AGGI) showing radiativeforcing of climate due to long-lived greenhouse gases from 1979 to 2008. On the right axis, the AGGI is indexed to 1 on January 1, 1990. For 2009, the AGGI represents an increase in total radiative forcing of 27.5% since 1990. Methane produces about 20% of present day greenhouse gas climate forcing. Methane is produced by fossil fuel production and agriculture. NOAA Ozone Depleting Gas Index (ODGI-A) Antarctic Ozone Hole Balloon Flights The Mauna Loa Observatory (MLO) was established in 1957 and has steadily grown in the number of scientific measurements conducted at the facility (now exceeding 250). The undisturbed air, remote location, and minimal influences of vegetation and human activity at MLO are ideal for monitoring constituents in the atmosphere that can cause climate change. “Providing the best possible information on atmospheric constituents that drive climate change, stratospheric ozone depletion, and baseline air quality.” The individual gases that have been primarily responsible for the decline in Equivalent Chlorine (ECl) to date by all long-lived chlorine- and bromine-containing gases. HCFC’s continue to increase and production is not scheduled for a complete phase-out until 2030, they currently contribute relatively little (~5% or less) to the atmospheric burden of ECl and EECl. Altitude (kilometers) versus ozone partial pressure (millipascals) of selected balloon-borne ozonesonde profiles from South Pole Station. The graph illustrates the progression of the ozone hole from pre-ozone hole conditions. For more information, please visit: http://www.esrl.noaa.gov/gmd/