Download
1 / 48
480 likes | 587 Views
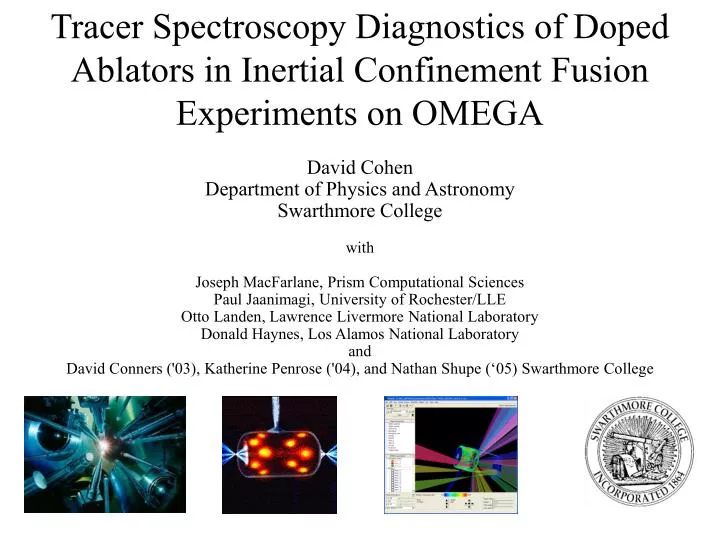
Tracer Spectroscopy Diagnostics of Doped Ablators in Inertial Confinement Fusion Experiments on OMEGA. David Cohen Department of Physics and Astronomy Swarthmore College with Joseph MacFarlane, Prism Computational Sciences Paul Jaanimagi, University of Rochester/LLE

E N D
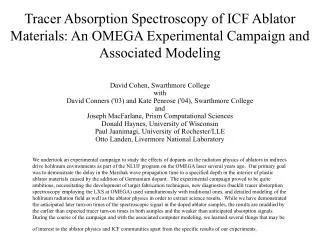
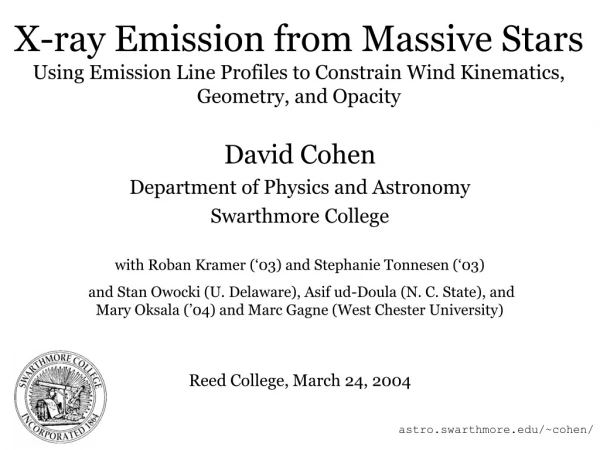
Tracer Spectroscopy Diagnostics of Doped Ablators in Inertial Confinement Fusion Experiments on OMEGA David Cohen Department of Physics and Astronomy Swarthmore College with Joseph MacFarlane, Prism Computational Sciences Paul Jaanimagi, University of Rochester/LLE Otto Landen, Lawrence Livermore National Laboratory Donald Haynes, Los Alamos National Laboratory and David Conners ('03), Katherine Penrose ('04), and Nathan Shupe (‘05) Swarthmore College
OUTLINE • Scientific Context ablator dopants tracer spectral diagnostics • Experiment Design • Targets • Data and Overview of Results • Modeling • Conclusions
Context Ablator dopants are used to control fuel pre-heat, but they also affect the radiation hydrodynamics of the interaction between the hohlraum radiation field and the capsule.
A small amount of dopant - here 1.8% by atom of germanium - can significantly increase the opacity of a low-Z ablator LTE opacity at kT=100 eV, nion=1021 cm-2
Ablator dopants affect the opacity and density, changing the manner in which energy is absorbed by the ablator. Controlling the process requires a means of diagnosing the properties of doped and undoped ablators in the hohlraum environment. Burnthrough and shock breakout experiments (ex. shown at right) measure the properties of ablators and their response to hohlraum radiation fields integrated over the duration of the experiment. Also, ablators have been evaluated spectroscopically via emission in gas-filled capsule implosions. Olson et al.
In a different context, Perry et al. showed that absorption spectroscopy in multi-layered targets could diagnose radiation transport. And Chenais-Popovics et al. showed that Cl Ka absorption spectroscopy could diagnose material properties. Laser-produced Bi plasma provided the backlighter continuum source. From Chenais-Popovics et al. 1989
We have combined these ideas, and building on a previous effort to measure tracer emission spectra from aluminum witness plates with Tina Back, proposed an experimental campaign to use backlit Cl Ka absorption spectroscopy to diagnose radiation physics in the interior of ablator samples. We proposed to do this by placing thin tracer layers at specified depths in the interiors of ablator samples mounted on hohlraums. The spectroscopy monitors the ionization conditions in that layer, effectively diagnosing the time-dependent plasma properties at a specific location inside the sample. A time-delay in the turn-on time of the tracer signal between doped and undoped samples should allow us to determine the effects of dopants on the Marshak wave propagation.
Experimental Set-up Including schematics of diagnostic lines-of-sight Note: only one (blue) beam into the halfraum is shown here,for simplicity. All shots were carried out with 15 beams.
Thin tracers embedded at known depths in planar ablator samples provide a spectroscopic signal when the Marshak wave reaches a specific location in the ablator. ~5 m ~30 m We will be comparing data from two shots in our OMEGA campaign: 19526: undoped, tracer depth 6.3 m 19528: doped, tracer depth 4.1m halfraum radiation NaCl tracer <0.5m The time-dependent drive spectrum is modeled and constrained by DANTE Ge-doped or undoped plastic
undoped doped Tracer signals turn on earlier in the undoped sample
Experimental Configuration LEH facing P-7 (LXS in P-6) Gold Halfraums: L=1200m, R=800m washer/aperture positioning wires Pb-doped plastic mount Bi/Pb backligher foil TVS-X view
Ablator samples were mounted on the ends of halfraums; backlighter foils hung ~1.5mm from LEH Several views of a target: taken at the LLE metrology lab
SEM images of finished ablator samples Leakage of KF tracer onto front of plate (right), but no similar problem in samples with NaCl tracer (left); we used the ablator samples with NaCl tracers. General Atomics produced these witness plates by first making the thicker plastic layer via glow-discharge polymerization (GDP); The salt layer was deposited on this plastic, and then the whole assembly was put back in the GDP chamber and an additional ~5m of plastic was deposited on top.
SEM image of cross-section of target Note the salt crystals…perhaps an artifact of SEM sample preparation, but would weaken the spectral signal if representative of tracer properties in the samples we shot.
So, we’ve got our assembled targets, and now we’re going to shoot the halfraums
undoped doped Be Li He Digitized section of film from LXS/streak-camera: Features from three ion stages of chlorine are indicated; Note the temporal and spectral structure in the backlighter emission; this makes it difficult to bring out the tracer features effectively at all times in this color-scale representation.Note also that the backlighter signal is weak at early times (we staggered the backlighter beams in time).
Data: time-resolved tracer spectra: lineouts from film shown on previous slide shot 19526: undoped tracer at 6.3 mm shot 19528: doped tracer at 4.1 mm Undoped: Be-like @ 300 ps, Li-like @ 400 ps; Doped: up to He-like @ 400 ps
Taken at face value, the data seem to indicate the slower Marshak wave propagation in the doped sample, but before we can draw any conclusions… Modeling
Set up a halfraum target model in the VisRad view factor code Specify material properties (albedos, laser reflectivities)
Put actual beam powers onto target (backlighter too) A series of time-independent calculations, with beam powers, albedos, XCEs varying at each time step
Calculate radiation field and material properties at every surface Emission temperature shown here (note laser hot spots), but also calculate incident flux on ablator sample
VisRad simulations DANTE view on top, incident flux on left; spectrum incident on ablator sample in lower right
View-factor modeling is useful for addressing various issues related to hohlraum radiation conditions
Glint Up to 135 TW/cm2 of reflected laser light on to ablator sample.
Radiation temperature as a function of beam pointing for three different albedo/XCE combinations, comparing DANTE (red) and WP (black) values. Radiation temperature differences between DANTE and sample can be significant.
Modeled spectra onto the sample and DANTE-view: even when the radiation temperatures are very similar, the spectral energy distributions are different (from each other and compared to a blackbody). TDANTE = 176.7 eV TWP= 175.0 eV
Effect of backlighter on radiation incident on ablator sample Ratio of spectrum onto ablator with backlighter included to that without: 10% effect with six backlighter beams; bigger effect at higher photon energies.
VisRad successfully modeled OMEGA hohlraum shots: DANTE data (Decker et al., PRL, 1997) Assumed albedo (top) and XCE (bottom) vs. time TR at the midplane (green triangles) is different than wall re-emission seen by DANTE
DANTE data was almost identical for our two shots (left) But it is low (filled triangles, right) compared to our modeling (open symbols, right) Note also: different TR on ablator sample (squares) and seen by DANTE (circles) We are in the process of correcting for the reduced DANTE sensitivity at the time of our shots
HELIOS hydro modeling, using incident flux from view-factor modeling Times indicated in units of 100 ps Undoped: faster hydro evolution Doped: slower hydro evolution
The hydro output is then post-processed with Spect3d: statistical equilibrium and spectral synthesis
undoped doped Tracer signals turn on earlier in the undoped sample (as we saw before; when tracers in two samples are at the same depth)
Undoped: tracer at 6.3 mm Doped: tracer at 4.1 mm Shallower tracer in doped samples actually causes earlier turn on in this specific doped target
undoped doped Be Li He Back to the Data…
Data: time-resolved tracer spectra shot 19526: undoped tracer at 6.3 mm shot 19528: doped tracer at 4.1 mm
undoped doped Turn-on of Be-like: earlier in data than model (300 vs 500 ps) Turn-on time in better agreement: 400 ps
Taking the turn-on times from the data, and the tracer depths: • The Marshak wave propagation: • 2.5 mg cm-2 ns-1 for the undoped ablator • 1.3 mg cm-2 ns-1 for the doped ablator • The dopant has a significant effect on the rad hydro • But, early turn-on time in undoped sample, relatively weak signal, inability to measure ion stages in the Cl tracer lower than Be-like…
Similar tracer spectral diagnostics have been shown to be quite useful on Z-machine experiments involving foams And the Spect3d spectral modeling has shown very good agreement with those data
Mg absorption spectra Data Calc • 5 mg/cc CH2 foam samples • Z-pinch heats and backlights samples • 3 samples on 3 lines-of-sight • MgF2 tracers placed at 4 different depths • Mg absorption spectrum recorded on time-integrated • convex crystal spectrometer (R ~ 800) Courtesy Greg Rochau
CONCLUSIONS - Backlit tracer absorption spectroscopy is hard to accomplish cleanly in a hohlraum environment - But, the tracer spectral data seem to indicate qualitatively the expected effect of the ablator dopant - Modeling the hohlraum environment is important - Future experiments might emply chlorinated plastic rather than salt as a tracer and a more evenly powered backlighter
Our original plan was to make side-by-side measurements on doped and undoped ablators mounted on the same hohlraum Due to the complexity of these targets, we were not able to get good data We mounted them first on the outside of hohlraums, near the midplane; one spectrometer with two separate crystals was used (K tracer in one side, Cl in the other) A halfraum with two samples (two tracers, two backlighters) and two spectrometers
We never were able to successfully measure a tracer spectral signal on these experiments: • Lower-than expected drive temperatures (tracers deeper than they ought to have been) • “Cross-talk” between samples; emission seen by spectrometers not coming from line-of-sight through samples? • Problems with one spectrometer Other ambitious plans included use of wedge witness plates to make passive shock breakout measurements (VISAR with J. Oertel) simultaneously with tracer spectroscopy
And higher still… If there are large gaps in the tracer layer, no amount of average areal mass will provide a strong signal.