Download
1 / 14
140 likes | 257 Views
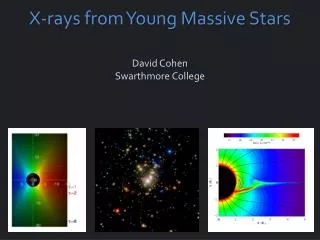
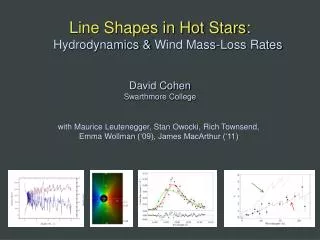
Visualizing Numerical Simulations of Magnetized Stellar Winds and the Synthesis of Observational Diagnostics. Stephen St.Vincent (Swarthmore, class of 2007) Advisor: Prof. David Cohen.

E N D
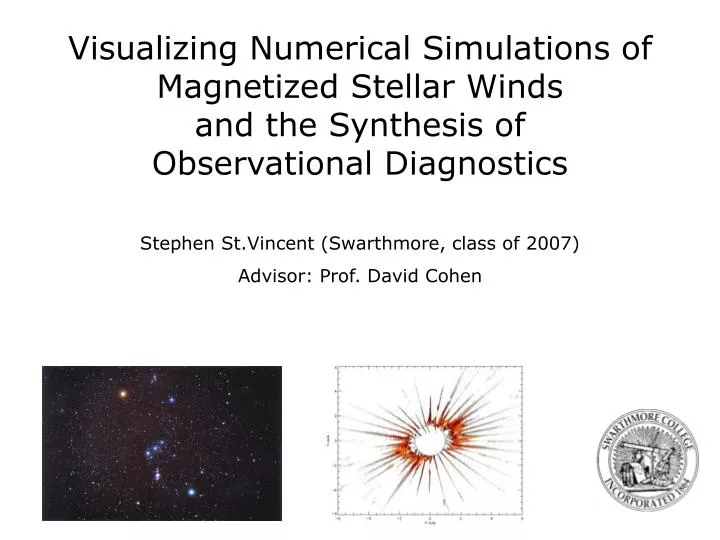
Visualizing Numerical Simulations of Magnetized Stellar Windsand the Synthesis of Observational Diagnostics Stephen St.Vincent (Swarthmore, class of 2007) Advisor: Prof. David Cohen
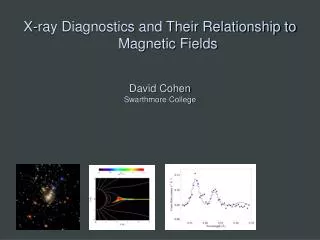
We are working with a group doing numerical simulations of magnetized stellar winds, led by Stan Owocki and Asif ud-Doula here at the University of Delaware. Basic scientific question: how do the combined effects of a large scale magnetic field and rapid stellar rotation influence the dynamics of the stellar winds of young, hot, magnetized stars. Can such a Magnetically Channeled Wind Shock (MCWS) model explain: • The strong and hard (i.e. high energy) x-ray emission seen from this class of stars? • Strong x-ray flaring seen in some of these stars? • The rotational modulation of x-rays and optical light? • The signatures of infalling material seen in H-alpha (optical) spectra?
About ten years ago, it was proposed that this MCWS model can apply to the star that illuminates the Orion nebula theta1 Ori C. theta1 Ori C is very bright in this x-ray telescope image
Asif ud-Doula and Stan Owocki here at U. Delaware (Bartol) do numerical simulations of the MCWS model, in which the magnetic field structure and the stellar wind flow is solved time-dependently and self-consistently. These simulations produce time-dependent physical parameter values (density, temperature, magnetic field, velocity) on a three-dimensional spatial grid. We want to(a) visualize the simulations; (b) characterize the overall properties (e.g. monitor rate of material falling back onto the star); (c) synthesize observables for comparison with data. A snapshot of the density (grayscale) and magnetic field lines (white lines) from Asif’s simulations.
Steve is a dual computer science - astronomy major His goal is to produce a well tested and documented code with an intuitive GUI – a package that other members of the group, and future students, can use, even after Steve graduates. Steve working in the astronomy lab this past summer.
Visualizations link to movie Here’s a snapshot (on the left) showing high-temperature material in the magnetic equator. The movie this snapshot was taken from is on the right.
Because the magnetic field is tilted with respect to the rotation axis, as the star rotates, we get different views of its magnetosphere. Visualization of rotating magnetic field geometry. One of our simulations, emphasizing the computational grid, also rotating. link to movie link to movie
Taking the Simulations Further • While the original 2D simulations are useful, we need specific diagnostics that ultimately can be compared with data • Line profiles • Light curves • Rotation phase dependent information • How do I accomplish this? • Take existing data (density, velocity vectors) and calculate synthesized diagnostics (emission measure, line-of-sight velocity) - include effects like occultation of emitting material by the star, and spectral line broadening • Create quasi-3D models from 2D slices • Rotate these models according to the star's rotation to model phase-dependence - i.e. the user can control the viewing angle for synthesized observables.
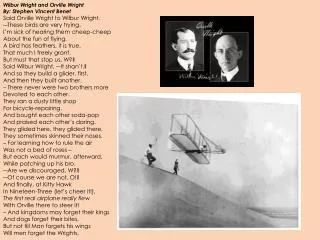
Line-of-sight Velocity Contour plot (line-of-sight velocities for an observer at the top of the frame) Spectral line profile At each point on the grid, the material has a different Doppler shift, which then affects the overall spectral line profile
Line-of-sight Velocity Movie link to movie
The Graphical User Interface (GUI) • Entering all parameters at command line is painful • GUI can save/restore settings to avoid frequent re-entering of parameters • Also checks validity of parameters (minx < maxx, etc) • Hopefully, someone else can run the code with relative ease using the GUI
Website as a Paradigm for Research Organization • For the past two years, I’ve maintained a personal research website to organize my thoughts, ideas, results, and future plans. • http://www.sccs.swarthmore.edu/users/07/sstvinc2/research • Can easily refer to work I’ve previously done (like a lab notebook) • Prof. Cohen can check my progress; so can off-site collaborators • I can access my notes from anywhere • Handy for showing results quickly
Application Documentation • Future usability is a major concern – someone besides myself needs to be able to run my code • Three major steps to achieving this: • Well-commented, modular code • GUI • Documentation: http://astro.swarthmore.edu/~sstvinc2/manual.pdf • Documentation acts as a user's manual for my program • Also includes any important equations and concepts that went into calculations or overall design
Conclusions • Undergraduates - especially with programming experience and a C.S. background - can make useful contributions to large-scale scientific computing projects • Organization and usability are key if a students’ scientific productivity is to be more than transient • Connecting numerical simulations to observations/experiment provides an opportunity for students to learn about several aspects of scientific research • The MCWS model looks very promising for explaining the observed properties of magnetized hot stars • Steve will be presenting his research results at the American Astronomical Society meeting in Seattle in January