Download
1 / 20
200 likes | 339 Views
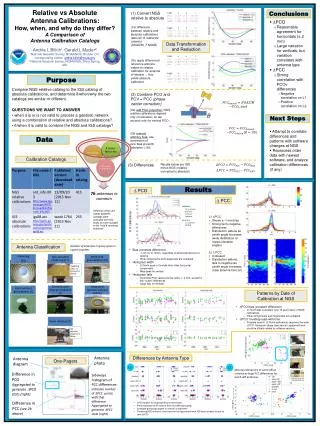
A comparison of absolute and relative vertical rates at the New Zealand cGPS@TG sites. Paul Denys 1 , John Beavan 2 , Ian Thomas 3 , Matt King 3 1 School of Surveying, Otago University, NZ 2 GNS Science, NZ 3 School of Civil Engineering and Geosciences, Newcastle University, UK.

E N D
A comparison of absolute and relative vertical rates at the New Zealand cGPS@TG sites Paul Denys1, John Beavan2, Ian Thomas3, Matt King3 1 School of Surveying, Otago University, NZ 2 GNS Science, NZ 3 School of Civil Engineering and Geosciences, Newcastle University, UK GNSS Vertical Rates Symposium, Newcastle, 2010
Outline • Tide gauge records • Tide gauge site stability • Vertical velocity rates
cGPS@TG sites in NZ AUCK TAKL NPLY WGTT WGTN LYTT MQZG DUNT OUSD
RSL Rates • < 1944, based on annual means rather than hourly data • Higher rate assumed to be due to lack of data < 1924 • New negative correction of 0.012m since 1956 • In 2004, wharf pile assumed to subsiding at -0.3mm/yr 1 sigma: ± 0.1 – 0.3 mm/yr
Factors Affecting Trends • GPS Environment • Harbour location • Reclaimed land Auckland, Wellington, Lyttelton, Dunedin • Proximity to CBD Auckland, Wellington • Proximity to hills Lyttelton, Dunedin • Vertical deformation • Sedimentation • Compaction * • Water, gas, oil extraction • Tectonic effects at plate boundaries * • Glacial Isostatic Adjustment (GIA) *
TG / cGPS Site Stability Monitoring • Local stability: • TG pole/recorder connected to local benchmark network • Regional stability: • dual cGPS@TG sites
Dunedin TG Benchmarks Fixed BM TG Pole BM TG Ref BM
GPS levelling: WGTA to WGTT CGPS Location of WGTT cGPS (at Te Papa) Temporary GPS (WGTA) used to tie between tide gauge BM and WGTT
Precise and GPS levelling results: Wellington tide gauge
Vertical Velocity EstimatesStochastic Model • General linear model • diagonal covariance matrix of observations • White Noise Process: • assumes uncorrelated observations • e.g. – time series Periodic terms velocity Offset terms
Time Series Estimation • Techniques • Maximum Likelihood Estimation • VC Estimation e.g. MINQUE • Allan Variance • Auto Regression • Three solutions • Approx. Time • LSE : white noise < 1s • VCE : white noise + flicker noise 1-10m • MLE : white noise + power law CATS 2-4hrs Cheetah 1-10m
Vertical Rates 27km 4km 12km 11km OU NCL
Vertical rates and precisions (95% CI) Average sigma: ±0.3-0.5 mm/yr (excluding WN only)
Summary • Site stability is critical – TG and cGPS@TG sites • Most located on/close to reclaimed land • Monitoring is essential • Monitored using a variety of methods • Precise levelling to close BMs • GPS “levelling” to regional cGPS and TG BM • Dual cGPS baselines • cGPS velocity estimates • Consistency • <0.3 mm/yr within the relative (OU) and global (NCL) velocities • Estimated precision ~±0.3-0.5 mm/yr (1 sigma) • Mixture of agreement • 0.3 – 1 mm/yr between relative (OU) and global (NCL) velocities