Download
1 / 1
10 likes | 153 Views
Relative vs Absolute Antenna Calibrations: How, when, and why do they differ? A Comparison of Antenna Calibration Catalogs. Conclusions. PCO Reasonable agreement for horizontals (± 2 mm) Large variation for verticals, but variation correlates with antenna type PCC

E N D
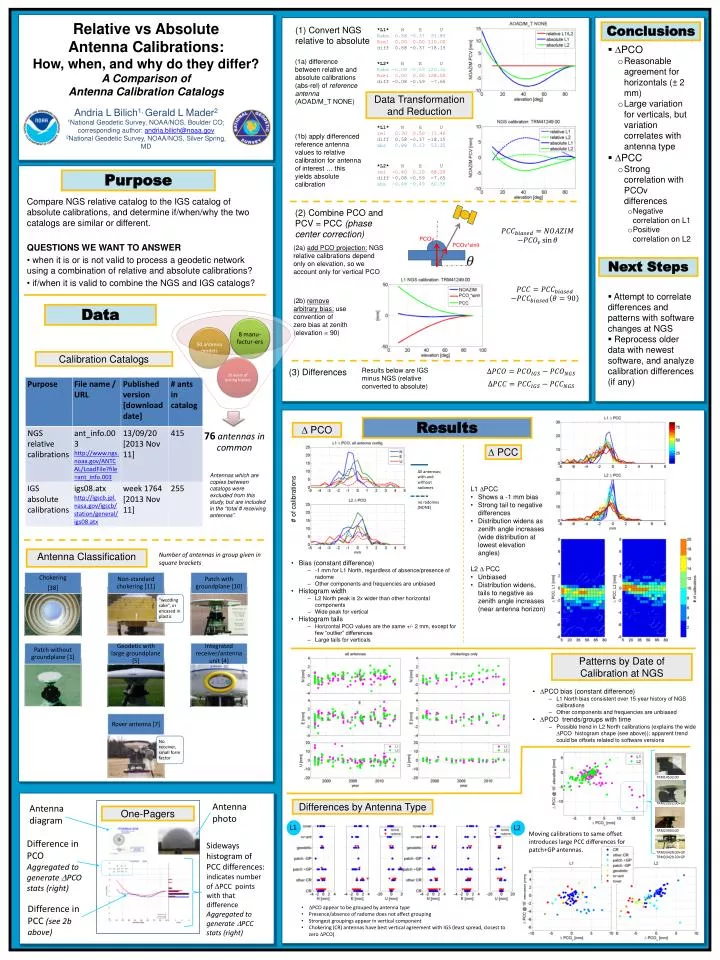
Relative vs Absolute Antenna Calibrations: How, when, and why do they differ? A Comparison of Antenna Calibration Catalogs Conclusions • PCO • Reasonable agreement for horizontals (± 2 mm) • Large variation for verticals, but variation correlates with antenna type • PCC • Strong correlation with PCOv differences • Negative correlation on L1 • Positive correlation on L2 PCO PCC (1) Convert NGS relative to absolute All antennas; with and without radomes *L1* N E U Rabs 0.58 -0.37 91.85 Rrel 0.00 0.00 110.00 diff 0.58 -0.37 -18.15 (1a) difference between relative and absolute calibrations (abs-rel) of reference antenna (AOAD/M_T NONE) L1 PCC • Shows a -1 mm bias • Strong tail to negative differences • Distribution widens as zenith angle increases (wide distribution at lowest elevation angles) L2 PCC • Unbiased • Distribution widens, tails to negative as zenith angle increases (near antenna horizon) Andria L Bilich1, Gerald L Mader21National Geodetic Survey, NOAA/NOS, Boulder CO; corresponding author: andria.bilich@noaa.gov 2National Geodetic Survey, NOAA/NOS, Silver Spring, MD no radomes (NONE) # of calibrations *L2* N E U Rabs -0.08 -0.59 120.35 Rrel 0.00 0.00 128.00 diff -0.08 -0.59 -7.65 Data Transformation and Reduction *L1* N E U rel 0.30 0.50 71.40 diff 0.58 -0.37 -18.15abs 0.88 0.13 53.25 Purpose (1b) apply differenced reference antenna values to relative calibration for antenna of interest … this yields absolute calibration *L2* N E U rel -0.40 0.10 68.20 diff -0.08 -0.59 -7.65abs -0.48 -0.49 60.55 • Bias (constant difference) • -1 mm for L1 North, regardless of absence/presence of radome • Other components and frequencies are unbiased • Histogram width • L2 North peak is 2x wider than other horizontal components • Wide peak for vertical • Histogram tails • Horizontal PCO values are the same +/- 2 mm, except for few “outlier” differences • Large tails for verticals Compare NGS relative catalog to the IGS catalog of absolute calibrations, and determine if/when/why the two catalogs are similar or different. QUESTIONS WE WANT TO ANSWER • when it is or is not valid to process a geodetic network using a combination of relative and absolute calibrations? • if/when it is valid to combine the NGS and IGS catalogs? (2) Combine PCO and PCV = PCC (phase center correction) (2a) add PCO projection: NGS relative calibrations depend only on elevation, so we account only for vertical PCO PCOv Next Steps PCOv*sin Patterns by Date of Calibration at NGS • Attempt to correlate differences and patterns with software changes at NGS • Reprocess older data with newest software, and analyze calibration differences (if any) (2b) remove arbitrary bias: use convention of zero bias at zenith (elevation = 90) Data Antenna Classification Number of antennas in group given in square brackets • PCO bias (constant difference) • L1 North bias consistent over 15-year history of NGS calibrations • Other components and frequencies are unbiased • PCO trends/groups with time • Possible trend in L2 North calibrations (explains the wide PCO histogram shape (see above)); apparent trend could be offsets related to software versions Antenna photo Calibration Catalogs Antenna diagram Results below are IGS minus NGS (relative converted to absolute) (3) Differences • Difference in PCO • Aggregated to generate PCO stats (right) • Sideways histogram of PCC differences: indicates number of PCC points with that difference • Aggregated to generate PCC stats (right) Results Differences by Antenna Type TRM14532.00 L2 L1 Difference in PCC (see 2b above) Antennas which are copies between catalogs were excluded from this study, but are included in the “total # receiving antennas”. TRM22022.00+GP TRM23903.00 TRM33429.00+GP TRM33429.20+GP • PCO appear to be grouped by antenna type • Presence/absence of radome does not affect grouping • Strongest groupings appear in vertical component • Chokering (CR) antennas have best vertical agreement with IGS (least spread, closest to zero PCO) One-Pagers Moving calibrations to same offset introduces large PCC differences for patch+GP antennas.