Download

1 / 50
500 likes | 724 Views
Cloud Technologies and Their Applications. Judy Qiu xqiu@indiana.edu http://salsahpc.indiana.edu Pervasive Technology Institute Indiana University. March 26, 2010 Indiana University Bloomington.

E N D
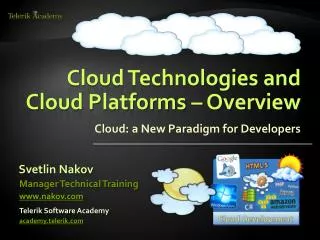
Cloud Technologies and Their Applications Judy Qiu xqiu@indiana.edu • http://salsahpc.indiana.edu • Pervasive Technology Institute • Indiana University March 26, 2010 Indiana University Bloomington
The term SALSA or Service Aggregated Linked Sequential Activities, is derived from Hoare’s Concurrent Sequential Processes (CSP) • SALSA Group • http://salsahpc.indiana.edu • Group Leader: Judy Qiu • Staff : Scott Beason • CS PhD: JaliyaEkanayake, ThilinaGunarathne, JongYoulChoi, Seung-HeeBae, • Yang Ruan, Hui Li, Bingjing Zhang, SaliyaEkanayake, • CS Masters: Stephen Wu • Undergraduates: Zachary Adda, Jeremy Kasting, William Bowman
Important Trends • In all fields of science and throughout life (e.g. web!) • Impacts preservation, access/use, programming model • new commercially supported data center model building on compute grids • Data Deluge • Cloud Technologies • eScience Multicore/ Parallel Computing • Implies parallel computing important again • Performance from extra cores – not extra clock speed • A spectrum of eScience or eResearch applications (biology, chemistry, physics social science and • humanities …) • Data Analysis • Machine learning
Challenges for CS Research Science faces a data deluge. How to manage and analyze information? Recommend CSTB foster tools for data capture, data curation, data analysis ―Jim Gray’s Talk to Computer Science and Telecommunication Board (CSTB), Jan 11, 2007 There’re several challenges to realizing the vision on data intensive systems and building generic tools (Workflow, Databases, Algorithms, Visualization ). Cluster-management software Distributed-execution engine Language constructs Parallel compilers Program Development tools . . .
Data Explosion and Challenges • Data Deluge • Cloud Technologies • eScience • Multicore/ • Parallel Computing
Data We’re Looking at High volume and high dimension require new efficient computing approaches! • Public Health Data (IU Medical School & IUPUI Polis Center) (65535 Patient/GIS records / 54 dimensions each) • Biology DNA sequence alignments (IU Medical School & CGB) (several million Sequences / at least 300 to 400 base pair each) • NIH PubChem (David Wild) (60 million chemical compounds/166 fingerprints each) • Particle physics LHC (Caltech) (1 Terabyte data placed in IU Data Capacitor)
Cloud Services and MapReduce • Data Deluge • Cloud Technologies • eScience • Multicore/ • Parallel Computing
Clouds as Cost Effective Data Centers Builds giant data centers with 100,000’s of computers; ~ 200-1000 to a shipping container with Internet access “Microsoft will cram between 150 and 220 shipping containers filled with data center gear into a new 500,000 square foot Chicago facility. This move marks the most significant, public use of the shipping container systems popularized by the likes of Sun Microsystems and Rackable Systems to date.” ―News Release from Web
Clouds hide Complexity Cyberinfrastructure Is “Research as a Service” • SaaS: Software as a Service • (e.g. Clustering is a service) • PaaS: Platform as a Service • IaaS plus core software capabilities on which you build SaaS • (e.g. Azure is a PaaS; MapReduce is a Platform) • IaaS(HaaS): Infrasturcture as a Service • (get computer time with a credit card and with a Web interface like EC2)
Commercial Cloud Software
Reduce(Key, List<Value>) Map(Key, Value) MapReduce A parallel Runtime coming from Information Retrieval Data Partitions A hash function maps the results of the map tasks to r reduce tasks Reduce Outputs • Implementations support: • Splitting of data • Passing the output of map functions to reduce functions • Sorting the inputs to the reduce function based on the intermediate keys • Quality of services
Sam’s Problem • He used a to cut the and a to make juice. Sam thought of “drinking” the apple
Creative Sam Each input to a map is a list of <key, value> pairs Fruits A list of <key, value> pairs mapped into another list of <key, value> pairs which gets grouped by the key and reduced into a list of values (<a, > , <o, > , <p, > , …) Each output of slice is a list of <key, value> pairs (<a’, > , <o’, > , <p’, > ) Grouped by key The idea of Map Reduce in Data Intensive Computing Each input to a reduce is a <key, value-list> (possibly a list of these, depending on the grouping/hashing mechanism) e.g. <ao, ( …)> Reduced into a list of values Implemented a parallelversion of his innovation
Edge : communication path Vertex : execution task Hadoop & DryadLINQ Apache Hadoop Microsoft DryadLINQ Standard LINQ operations Master Node Data/Compute Nodes DryadLINQ operations Job Tracker • Dryad process the DAG executing vertices on compute clusters • LINQ provides a query interface for structured data • Provide Hash, Range, and Round-Robin partition patterns • Apache Implementation of Google’s MapReduce • Hadoop Distributed File System (HDFS) manage data • Map/Reduce tasks are scheduled based on data locality in HDFS (replicated data blocks) M M M M R R R R HDFS Name Node Data blocks DryadLINQ Compiler 1 2 2 3 3 4 Directed Acyclic Graph (DAG) based execution flows Dryad Execution Engine • Job creation; Resource management; Fault tolerance& re-execution of failed taskes/vertices
High Energy Physics Data Analysis An application analyzing data from Large Hadron Collider(1TB but 100 Petabytes eventually) Input to a map task: <key, value> key = Some Id value = HEP file Name Output of a map task: <key, value> key = random # (0<= num<= max reduce tasks) value = Histogram as binary data Input to a reduce task: <key, List<value>> key = random # (0<= num<= max reduce tasks) value = List of histogram as binary data Output from a reduce task: value value = Histogram file Combine outputs from reduce tasks to form the final histogram
Reduce Phase of Particle Physics “Find the Higgs” using Dryad Higgs in Monte Carlo Combine Histograms produced by separate Root “Maps” (of event data to partial histograms) into a single Histogram delivered to Client This is an example using MapReduce to do distributed histogramming.
Applications using Dryad & DryadLINQ Input files (FASTA) • CAP3 - Expressed Sequence Tag assembly to re-construct full-length mRNA CAP3 CAP3 CAP3 DryadLINQ Output files X. Huang, A. Madan, “CAP3: A DNA Sequence Assembly Program,” Genome Research, vol. 9, no. 9, pp. 868-877, 1999. Perform using DryadLINQ and Apache Hadoop implementations Single “Select” operation in DryadLINQ “Map only” operation in Hadoop
Architecture of EC2 and Azure Cloud for Cap3 HDFS Input Data Set Data File Map() Map() Executable Optional Reduce Phase Reduce Results HDFS
Usability and Performance of Different Cloud Approaches • Cap3 Performance Cap3 Efficiency • Efficiency = absolute sequential run time / (number of cores * parallel run time) • Hadoop, DryadLINQ - 32 nodes (256 cores IDataPlex) • EC2 - 16 High CPU extra large instances (128 cores) • Azure- 128 small instances (128 cores) • Ease of Use – Dryad/Hadoop are easier than EC2/Azure as higher level models • Lines of code including file copy • Azure : ~300 Hadoop: ~400 Dyrad: ~450 EC2 : ~700
4096 Cap3 data files : 1.06 GB / 1875968 reads (458 readsX4096).. Following is the cost to process 4096 CAP3 files.. Amortized cost in Tempest (24 core X 32 nodes, 48 GB per node) = 9.43$ (Assume 70% utilization, write off over 3 years, include support)
Data Intensive Applications • Data Deluge • Cloud Technologies • eScience • Multicore
Some Life Sciences Applications EST (Expressed Sequence Tag)sequence assembly program using DNA sequence assembly program software CAP3. Metagenomics and Alu repetition alignment using Smith Waterman dissimilarity computations followed by MPI applications for Clustering and MDS (Multi Dimensional Scaling) for dimension reduction before visualization Mapping the 60 million entries in PubCheminto two or three dimensions to aid selection of related chemicals with convenient Google Earth like Browser. This uses either hierarchical MDS (which cannot be applied directly as O(N2)) or GTM (Generative Topographic Mapping). Correlating Childhood obesity with environmental factorsby combining medical records with Geographical Information data with over 100 attributes using correlation computation, MDS and genetic algorithms for choosing optimal environmental factors.
DNA Sequencing Pipeline MapReduce Illumina/Solexa Roche/454 Life Sciences Applied Biosystems/SOLiD Pairwise clustering Blocking MDS MPI Modern Commercial Gene Sequencers Visualization Plotviz Sequence alignment Dissimilarity Matrix N(N-1)/2 values block Pairings FASTA FileN Sequences Read Alignment Internet • This chart illustrate our research of a pipeline mode to provide services on demand (Software as a Service SaaS) • User submit their jobs to the pipeline. The components are services and so is the whole pipeline.
Alu and Metagenomics Workflow “All pairs” problem Data is a collection of N sequences. Need to calcuate N2dissimilarities (distances) between sequnces (all pairs). • These cannot be thought of as vectors because there are missing characters • “Multiple Sequence Alignment” (creating vectors of characters) doesn’t seem to work if N larger than O(100), where 100’s of characters long. Step 1: Can calculate N2 dissimilarities (distances) between sequences Step 2: Find families by clustering (using much better methods than Kmeans). As no vectors, use vector free O(N2) methods Step 3: Map to 3D for visualization using Multidimensional Scaling (MDS) – also O(N2) Results: N = 50,000 runs in 10 hours (the complete pipeline above) on 768 cores Discussions: • Need to address millions of sequences ….. • Currently using a mix of MapReduce and MPI • Twister will do all steps as MDS, Clustering just need MPI Broadcast/Reduce
Biology MDS and Clustering Results Alu Families This visualizes results of Alu repeats from Chimpanzee and Human Genomes. Young families (green, yellow) are seen as tight clusters. This is projection of MDS dimension reduction to 3D of 35399 repeats – each with about 400 base pairs Metagenomics This visualizes results of dimension reduction to 3D of 30000 gene sequences from an environmental sample. The many different genes are classified by clustering algorithm and visualized by MDS dimension reduction
All-Pairs Using DryadLINQ 125 million distances 4 hours & 46 minutes Calculate Pairwise Distances (Smith Waterman Gotoh) Moretti, C., Bui, H., Hollingsworth, K., Rich, B., Flynn, P., & Thain, D. (2009). All-Pairs: An Abstraction for Data Intensive Computing on Campus Grids. IEEE Transactions on Parallel and Distributed Systems, 21, 21-36. • Calculate pairwise distances for a collection of genes (used for clustering, MDS) • Fine grained tasks in MPI • Coarse grained tasks in DryadLINQ • Performed on 768 cores (Tempest Cluster)
Hadoop/Dryad ComparisonInhomogeneous Data I Inhomogeneity of data does not have a significant effect when the sequence lengths are randomly distributed Dryad with Windows HPCS compared to Hadoop with Linux RHEL on Idataplex (32 nodes)
Hadoop/Dryad ComparisonInhomogeneous Data II This shows the natural load balancing of Hadoop MR dynamic task assignment using a global pipe line in contrast to the DryadLinq static assignment Dryad with Windows HPCS compared to Hadoop with Linux RHEL on Idataplex (32 nodes)
Hadoop VM Performance Degradation Perf. Degradation = (Tvm – Tbaremetal)/Tbaremetal 15.3% Degradation at largest data set size
Parallel Computing and Software • Data Deluge Cloud Technologies • eScience Parallel Computing
Twister(MapReduce++) Pub/Sub Broker Network Map Worker • Streaming based communication • Intermediate results are directly transferred from the map tasks to the reduce tasks – eliminates local files • Cacheablemap/reduce tasks • Static data remains in memory • Combine phase to combine reductions • User Program is the composer of MapReduce computations • Extendsthe MapReduce model to iterativecomputations M Static data Configure() Worker Nodes Reduce Worker R D D MR Driver User Program Iterate MRDeamon D M M M M Data Read/Write R R R R User Program δ flow Communication Map(Key, Value) File System Data Split Reduce (Key, List<Value>) Close() Combine (Key, List<Value>) Different synchronization and intercommunication mechanisms used by the parallel runtimes
Iterative Computations K-means Matrix Multiplication Performance of K-Means Performance Matrix Multiplication
Parallel Computing and Algorithms • Data Deluge Cloud Technologies • eScience Parallel Computing
Parallel Data Analysis Algorithms on Multicore Developing a suite of parallel data-analysis capabilities • Clustering with deterministic annealing (DA) • Dimension Reduction for visualization and analysis (MDS, GTM) • Matrix algebraas needed • Matrix Multiplication • Equation Solving • Eigenvector/value Calculation
High Performance Dimension Reduction and Visualization • Need is pervasive • Large and high dimensional data are everywhere: biology, physics, Internet, … • Visualization can help data analysis • Visualization of large datasets with high performance • Map high-dimensional data into low dimensions (2D or 3D). • Need Parallel programming for processing large data sets • Developing high performance dimension reduction algorithms: • MDS(Multi-dimensional Scaling), used earlier in DNA sequencing application • GTM(Generative Topographic Mapping) • DA-MDS(Deterministic Annealing MDS) • DA-GTM(Deterministic Annealing GTM) • Interactive visualization tool PlotViz • We are supporting drug discovery by browsing 60 million compounds in PubChem database with 166 featureseach
Dimension Reduction Algorithms • Multidimensional Scaling (MDS) [1] • Given the proximity information among points. • Optimization problem to find mapping in target dimension of the given data based on pairwise proximity information while minimize the objective function. • Objective functions: STRESS (1) or SSTRESS (2) • Only needs pairwise distances ijbetween original points (typically not Euclidean) • dij(X) is Euclidean distance between mapped (3D) points • Generative Topographic Mapping (GTM) [2] • Find optimal K-representations for the given data (in 3D), known as K-cluster problem (NP-hard) • Original algorithm use EM method for optimization • Deterministic Annealing algorithm can be used for finding a global solution • Objective functions is to maximize log-likelihood: [1] I. Borg and P. J. Groenen. Modern Multidimensional Scaling: Theory and Applications. Springer, New York, NY, U.S.A., 2005. [2] C. Bishop, M. Svens´en, and C. Williams. GTM: The generative topographic mapping. Neural computation, 10(1):215–234, 1998.
High Performance Data Visualization.. GTM with interpolation for 2M PubChem data 2M PubChem data is plotted in 3D with GTM interpolation approach. Blue points are 100k sampled data and red points are 2M interpolated points. MDS for 100k PubChem data 100k PubChem data having 166 dimensions are visualized in 3D space. Colors represent 2 clusters separated by their structural proximity. GTM for 930k genes and diseases Genes (green color) and diseases (others) are plotted in 3D space, aiming at finding cause-and-effect relationships. PubChem project, http://pubchem.ncbi.nlm.nih.gov/ First time using Deterministic Annealing for parallel MDS and GTM algorithms to visualize large and high-dimensional data Processed 0.1 million PubChem data having 166 dimensions Parallel interpolation can process 60 million PubChem points
Interpolation Method n in-sample Trained data Training N-n out-of-sample Interpolated MDS/GTM map Interpolation Total N data MDS and GTM are highly memory and time consuming process for large dataset such as millions of data points MDS requires O(N2) and GTM does O(KN) (N is the number of data points and K is the number of latent variables) Training only for sampled data and interpolating for out-of-sample set can improve performance Interpolation is a pleasingly parallel application
Quality Comparison (Original vs. Interpolation) MDS GTM • Quality comparison between Interpolated result upto 100k based on the sample data (12.5k, 25k, and 50k) and original MDS result w/ 100k. • STRESS: wij = 1 / ∑δij2 Interpolation result (blue) is getting close to the original (read) result as sample size is increasing. 12.5K 25K 50K 100K Run on 16 nodes of Tempest Note that we gain performance of over a factor of 100 for this data size. It would be more for larger data set.
Convergence is Happening Data intensive application with basic activities: capture, curation, preservation, and analysis (visualization) Data Intensive Paradigms Cloud infrastructure and runtime Parallel threading and processes
Science Cloud (Dynamic Virtual Cluster) Architecture Smith Waterman Dissimilarities, CAP-3 Gene Assembly, PhyloD Using DryadLINQ, High Energy Physics, Clustering, Multidimensional Scaling, Generative Topological Mapping Applications Services and Workflow Apache Hadoop / Twister/ MPI Microsoft DryadLINQ / MPI Runtimes Linux Bare-system Windows Server 2008 HPC Bare-system Linux Virtual Machines Windows Server 2008 HPC Infrastructure software Xen Virtualization Xen Virtualization XCAT Infrastructure Hardware iDataplex Bare-metal Nodes Dynamic Virtual Cluster provisioning via XCAT Supports both stateful and stateless OS images
Dynamic Virtual Clusters • Monitoring & Control Infrastructure Monitoring Interface Monitoring Infrastructure • Dynamic Cluster Architecture Pub/Sub Broker Network SW-G Using Hadoop SW-G Using Hadoop SW-G Using DryadLINQ Virtual/Physical Clusters Linux Bare-system Linux on Xen Windows Server 2008 Bare-system XCAT Infrastructure Summarizer iDataplex Bare-metal Nodes (32 nodes) • Switchable clusters on the same hardware (~5 minutes between different OS such as Linux+Xen to Windows+HPCS) • Support for virtual clusters • SW-G : Smith Waterman Gotoh Dissimilarity Computation as an pleasingly parallel problem suitable for MapReduce style applications XCAT Infrastructure Switcher iDataplex Bare-metal Nodes
SALSA HPC Dynamic Virtual Clusters Demo • At top, these 3 clusters are switching applications on fixed environment. Takes ~30 Seconds. • At bottom, this cluster is switching between Environments – Linux; Linux +Xen; Windows + HPCS. Takes about ~7 minutes. • It demonstrates the concept of Science on Clouds using a FutureGrid cluster.
Summary of Plans • Intend to implement range of biology applications with Dryad/Hadoop/Twister • FutureGrid allows easy Windows v Linux with and without VM comparison • Initially we will make key capabilities available as services that we eventually implement on virtual clusters (clouds) to address very large problems • Basic Pairwise dissimilarity calculations • Capabilities already in R (done already by us and others) • MDS in various forms • GTM Generative Topographic Mapping • Vector and Pairwise Deterministic annealing clustering • Point viewer (Plotviz) either as download (to Windows!) or as a Web service gives Browsing • Should enable much larger problems than existing systems • Will look at Twister as a “universal” solution
Summary of Initial Results • Cloud technologies (Dryad/Hadoop/Azure/EC2) promising for Biology computations • Dynamic Virtual Clusters allow one to switch between different modes • Overhead of VM’s on Hadoop (15%) acceptable • Inhomogeneous problems currently favors Hadoop over Dryad • Twister allows iterative problems (classic linear algebra/datamining) to use MapReduce model efficiently • Prototype Twister released
Future Work The support for handling large data sets, the concept of moving computation to data, and the better quality of services provided by cloud technologies, make data analysis feasible on an unprecedented scale for assisting new scientific discovery. Combine "computational thinking“ with the “fourth paradigm” (Jim Gray on data intensive computing) Research from advance in Computer Science and Applications (scientific discovery)
Thank you! Collaborators Yves Brun, Peter Cherbas, Dennis Fortenberry, Roger Innes, David Nelson, Homer Twigg, Craig Stewart, Haixu Tang, Mina Rho, David Wild, Bin Cao, QianZhu, Gilbert Liu, Neil Devadasan Sponsors Microsoft Research, NIH, NSF, PTI