Download
1 / 50
500 likes | 868 Views
FutureGrid Cloud Technologies and Bioinformatics Applications. Geoffrey Fox gcf@indiana.edu http://salsaweb.ads.iu.edu/salsa Community Grids Laboratory Pervasive Technology Institute Indiana University. CloudCom 2009 Beijing Jiaotong University Beijing December 2 2009. FutureGrid.

E N D
FutureGridCloud Technologies and Bioinformatics Applications Geoffrey Fox • gcf@indiana.eduhttp://salsaweb.ads.iu.edu/salsa • Community Grids Laboratory • Pervasive Technology Institute • Indiana University CloudCom 2009 Beijing Jiaotong University Beijing December 2 2009
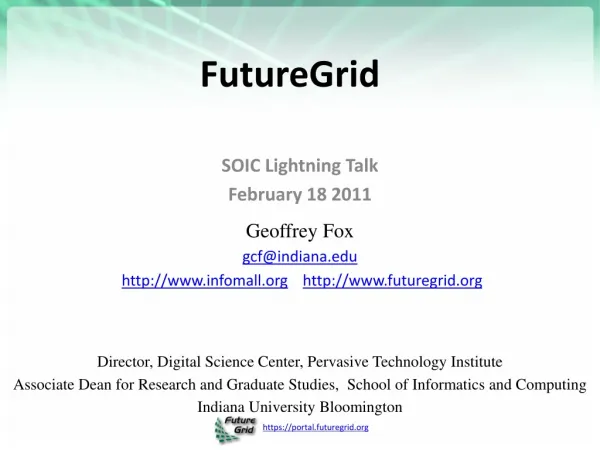
FutureGrid • The goal of FutureGrid is to support the research on the future of distributed, grid, and cloud computing. • FutureGrid will build a robustly managed simulation environment or testbed to support the development and early use in science of new technologies at all levels of the software stack: from networking to middleware to scientific applications. • The environment will mimic TeraGrid and/or general parallel and distributed systems – FutureGrid is part of TeraGrid and one of two experimental TeraGrid systems (other is GPU) • This test-bed will succeed if it enables major advances in science and engineering through collaborative development of science applications and related software. • FutureGrid is a (small >5000 core) Science/Computer Science Cloud but it is more accurately a virtual machine based simulation environment
Storage Hardware • FutureGrid has dedicated network (except to TACC) and a network fault and delay generator • Can isolate experiments on request; IU runs Network for NLR/Internet2 • Additional partner machines could run FutureGrid software and be supported (but allocated in specialized ways)
Network Impairments Device • Spirent XGEM Network Impairments Simulator for jitter, errors, delay, etc • Full Bidirectional 10G w/64 byte packets • up to 15 seconds introduced delay (in 16ns increments) • 0-100% introduced packet loss in .0001% increments • Packet manipulation in first 2000 bytes • up to 16k frame size • TCL for scripting, HTML for human configuration
FutureGrid Partners • Indiana University (Architecture, core software, Support) • Purdue University (HTC Hardware) • San Diego Supercomputer Center at University of California San Diego (INCA, Monitoring) • University of Chicago/Argonne National Labs (Nimbus) • University of Florida (ViNE, Education and Outreach) • University of Southern California Information Sciences Institute (Pegasus to manage experiments) • University of Tennessee Knoxville (Benchmarking) • University of Texas at Austin/Texas Advanced Computing Center (Portal) • University of Virginia (OGF, Advisory Board and allocation) • Center for Information Services and GWT-TUD from TechnischeUniverstität Dresden Germany. (VAMPIR) • Blue institutions have FutureGrid hardware
Other Important Collaborators • NSF • Early users from an application and computer science perspective and from both research and education • Grid5000/Aladdin and D-Grid in Europe • Commercial partners such as • Eucalyptus …. • Microsoft (Dryad + Azure) – Note current Azure external to FutureGrid as are GPU systems • Application partners • TeraGrid • Open Grid Forum • Possibly Open Nebula, Open Cirrus Testbed, Open Cloud Consortium, Cloud Computing Interoperability Forum. IBM-Google-NSF Cloud, and other DoE/NSF/… clouds • China, Japan, Korea, Australia, other Europe … ?
FutureGrid Usage Scenarios • Developers of end-user applications who want to develop new applications in cloud or grid environments, including analogs of commercial cloud environments such as Amazon or Google. • Is a Science Cloud for me? Is my application secure? • Developers of end-user applications who want to experiment with multiple hardware environments. • Grid/Cloud middleware developers who want to evaluate new versions of middleware or new systems. • Networking researchers who want to test and compare different networking solutions in support of grid and cloud applications and middleware. (Some types of networking research will likely best be done via through the GENI program.) • Education as well as research • Interest in performance requires that bare metal important
Selected FutureGrid Timeline • October 1 2009 Project Starts • November 16-19 SC09 Demo/F2F Committee Meetings/Chat up collaborators • January 2010 – Significant Hardware available • March 2010 FutureGrid network complete • March 2010 FutureGrid Annual Meeting • April 2010 Many early users • September 2010 All hardware (except Track IIC lookalike) accepted • October 1 2011 FutureGridallocatable via TeraGrid process – first two years by user/science board led by Andrew Grimshaw
FutureGrid Architecture • Open Architecture allows to configure resources based on images • Managed images allows to create similar experiment environments • Experiment management allows reproducible activities • Through our modular design we allow different clouds and images to be “rained” upon hardware. • Note will be supported 24x7 at “TeraGrid Production Quality” • Will support deployment of “important” middleware including TeraGrid stack, Condor, BOINC, gLite, Unicore, Genesis II
RAIN: Dynamic Provisioning • Change underlying system to support current user demands • Linux, Windows,Xen, Nimbus, Eucalyptus • Stateless images • Shorter boot times • Easier to maintain • Stateful installs • Windows • Use moab to trigger changes and xCAT to manage installs http://futuregrid.org
FutureGrid is a new part of TeraGrid Several Postdoc and Software Engineer Positions open Please apply
SALSA Dynamic Virtual Cluster Hosting Monitoring Infrastructure SW-G Using Hadoop SW-G Using Hadoop SW-G Using DryadLINQ SW-G Using Hadoop SW-G Using Hadoop SW-G Using DryadLINQ Linux Bare-system Linux on Xen Windows Server 2008 Bare-system Cluster Switching from Linux Bare-system to Xen VMs to Windows 2008 HPC xCATInfrastructure iDataplex Bare-metal Nodes (32 nodes) SW-G : Smith Waterman Gotoh Dissimilarity Computation – A typical MapReduce style application
Monitoring Infrastructure Pub/Sub Broker Network Monitoring Interface Virtual/Physical Clusters Summarizer xCATInfrastructure Switcher iDataplex Bare-metal Nodes (32 nodes)
Collaborators in SALSAProject Microsoft Research Technology Collaboration Azure (Clouds) Dennis Gannon Roger Barga Dryad (Parallel Runtime) Christophe Poulain CCR (Threading) George Chrysanthakopoulos DSS (Services) HenrikFrystykNielsen • Indiana University • SALSATechnology Team Geoffrey Fox Judy Qiu Scott Beason • Jaliya Ekanayake • Thilina Gunarathne • Thilina Gunarathne Jong Youl Choi Yang Ruan • Seung-Hee Bae • Hui Li • SaliyaEkanayake Applications Bioinformatics, CGB Haixu Tang, Mina Rho, Peter Cherbas, Qunfeng Dong IU Medical School Gilbert Liu Demographics (Polis Center) Neil Devadasan Cheminformatics David Wild, Qian Zhu Physics CMS group at Caltech (Julian Bunn) • Community Grids Lab • and UITS RT – PTI
Cluster Configurations Hadoop/ Dryad / MPI DryadLINQ DryadLINQ / MPI
Science Cloud (Dynamic Virtual Cluster) Architecture Smith Waterman Dissimilarities, CAP-3 Gene Assembly, PhyloD Using DryadLINQ, High Energy Physics, Clustering, Multidimensional Scaling, Generative Topological Mapping • Dynamic Virtual Cluster provisioning via xCAT • Supports both stateful and stateless OS images Applications Apache Hadoop / MapReduce++ / MPI Microsoft DryadLINQ / MPI Runtimes Linux Bare-system Windows Server 2008 HPC Bare-system Linux Virtual Machines Windows Server 2008 HPC Infrastructure software Xen Virtualization Xen Virtualization xCAT Infrastructure Hardware iDataplex Bare-metal Nodes
MapReduce “File/Data Repository” Parallelism Map = (data parallel) computation reading and writing data Reduce = Collective/Consolidation phase e.g. forming multiple global sums as in histogram Instruments Communication Iterative MapReduce Map MapMapMap Reduce ReduceReduce Portals/Users Reduce Map1 Map2 Map3 Disks
Cloud Computing: Infrastructure and Runtimes • Cloud infrastructure: outsourcing of servers, computing, data, file space, utility computing, etc. • Handled through Web services that control virtual machine lifecycles. • Cloud runtimes:tools (for using clouds) to do data-parallel computations. • Apache Hadoop, Google MapReduce, Microsoft Dryad, and others • Designed for information retrieval but are excellent for a wide range of science data analysis applications • Can also do much traditional parallel computing for data-mining if extended to support iterative operations • Not usually on Virtual Machines
Application Classes Old classification of Parallel software/hardware in terms of 5 (becoming 6) “Application architecture” Structures)
Applications & Different Interconnection Patterns Input map iterations Input Input map map Output Pij reduce reduce Domain of MapReduce and Iterative Extensions MPI
Some Life Sciences Applications • EST (Expressed Sequence Tag) sequence assembly program using DNA sequence assembly program software CAP3. • Metagenomics and Alu repetition alignment using Smith Waterman dissimilarity computations followed by MPI applications for Clustering and MDS (Multi Dimensional Scaling) for dimension reduction before visualization • CorrelatingChildhood obesity with environmental factors by combining medical records with Geographical Information data with over 100 attributes using correlation computation, MDS and genetic algorithms for choosing optimal environmental factors. • Mapping the 26 million entries in PubChem into two or three dimensions to aid selection of related chemicals with convenient Google Earth like Browser. This uses either hierarchical MDS (which cannot be applied directly as O(N2)) or GTM (Generative Topographic Mapping).
Alu and Sequencing Workflow • Data is a collection of N sequences – 100’s of characters long • These cannot be thought of as vectors because there are missing characters • “Multiple Sequence Alignment” (creating vectors of characters) doesn’t seem to work if N larger than O(100) • Can calculate N2 dissimilarities (distances) between sequences (all pairs) • Find families by clustering (much better methods than Kmeans). As no vectors, use vector free O(N2) methods • Map to 3D for visualization using Multidimensional Scaling MDS – also O(N2) • N = 50,000 runs in 10 hours (all above) on 768 cores • Our collaborators just gave us 170,000 sequences and want to look at 1.5 million – will develop new algorithms! • MapReduce++ will do all steps as MDS, Clustering just need MPI Broadcast/Reduce
Pairwise Distances – ALU Sequences • Calculate pairwise distances for a collection of genes (used for clustering, MDS) • O(N^2) problem • “Doubly Data Parallel” at Dryad Stage • Performance close to MPI • Performed on 768 cores (Tempest Cluster) 125 million distances 4 hours & 46 minutes Processes work better than threads when used inside vertices 100% utilization vs. 70%
DNA Sequencing Pipeline Illumina/Solexa Roche/454 Life Sciences Applied Biosystems/SOLiD Pairwise clustering Blocking MDS Internet Visualization Plotviz Form block Pairings Sequence alignment Dissimilarity Matrix N(N-1)/2 values FASTA FileN Sequences ~300 million base pairs per day leading to ~3000 sequences per day per instrument ? 500 instruments at ~0.5M$ each Read Alignment MPI MapReduce
Hadoop/Dryad Model Execution Model in Dryadand Hadoop Block Arrangement in Dryadand Hadoop Need to generate a single file with full NxN distance matrix
Dryad versus MPI for Smith Waterman Flat is perfect scaling
Hadoop/Dryad ComparisonInhomogeneous Data I Inhomogeneity of data does not have a significant effect when the sequence lengths are randomly distributed Dryad with Windows HPCS compared to Hadoop with Linux RHEL on Idataplex (32 nodes)
Hadoop/Dryad ComparisonInhomogeneous Data II This shows the natural load balancing of Hadoop MR dynamic task assignment using a global pipe line in contrast to the DryadLinq static assignment Dryad with Windows HPCS compared to Hadoop with Linux RHEL on Idataplex (32 nodes)
Hadoop VM Performance Degradation Perf. Degradation = (Tvm – Tbaremetal)/Tbaremetal • 15.3% Degradation at largest data set size
MapReduce++ (CGL-MapReduce) Pub/Sub Broker Network Map Worker M Worker Nodes D D MR Driver User Program Reduce Worker • Streaming based communication • Intermediate results are directly transferred from the map tasks to the reduce tasks – eliminates local files • Cacheable map/reduce tasks - Static data remains in memory • Combine phase to combine reductions • User Program is the composer of MapReduce computations • Extends the MapReduce model to iterative computations • Allow runtime to be invoked from MPI (later) R M M M M MRDeamon R R R R D File System Data Split Communication
Iterative Computations K-means Matrix Multiplication Performance of K-Means Parallel Overhead Matrix Multiplication
High Energy Physics Data Analysis • Histogramming of events from a large (up to 1TB) data set • Data analysis requires ROOT framework (ROOT Interpreted Scripts) • Performance depends on disk access speeds • Hadoop implementation uses a shared parallel file system (Lustre) • ROOT scripts cannot access data from HDFS • On demand data movement has significant overhead • Dryad stores data in local disks • Better performance
Reduce Phase of Particle Physics “Find the Higgs” using Dryad • Combine Histograms produced by separate Root “Maps” (of event data to partial histograms) into a single Histogram delivered to Client Higgs in Monte Carlo
High Performance Dimension Reduction and Visualization • Need is pervasive • Large and high dimensional data are everywhere: biology, physics, Internet, … • Visualization can help data analysis • Visualization with high performance • Map high-dimensional data into low dimensions. • Need high performance for processing large data • Developing high performance visualization algorithms: MDS(Multi-dimensional Scaling), GTM(Generative Topographic Mapping), DA-MDS(Deterministic Annealing MDS), DA-GTM(Deterministic Annealing GTM), …
Analysis of 26 Million PubChem Entries • 26 million PubChem compounds with 166 features • Drug discovery • Bioassay • 3D visualization for data exploration/mining • Mapping by O(N2) MDS(Multi-dimensional Scaling) and O(N) (but needs vectors) GTM(Generative Topographic Mapping) • Interactive visualization tool PlotViz • Discover hidden structures
MDS/GTM for 100K PubChem Number of Activity Results > 300 200 ~ 300 100 ~ 200 < 100 MDS GTM
Correlation between MDS/GTM MDS GTM Canonical Correlation between MDS & GTM
Summary: Key Features of our Approach • FutureGrid allows easy Windows v Linux with and without VM comparison • MapReduce works in loosely coupled problems but not in many datamining applications • Intend to implement range of biology applications with MapReduce++ • Initially we will make key capabilities available as services that we eventually implement on virtual clusters (clouds) to address very large problems • Basic Pairwise dissimilarity calculations • R (done already by us and others) • MDS in various forms • Vector and Pairwise Deterministic annealing clustering • Point viewer (Plotviz) either as download (to Windows!) or as a Web service • Note much of our code written in C# (high performance managed code) and runs on Microsoft HPCS 2008 (with Dryad extensions) • Hadoop code written in Java
Cloud Related Technology Research • MapReduce • Hadoop • Hadoop on Virtual Machines (private cloud) • Dryad (Microsoft) on Windows HPCS • MapReduce++ generalization to efficiently support iterative “maps” as in clustering, MDS … • Azure Microsoft cloud • FutureGrid dynamic virtual clusters switching between VM, “Baremetal”, Windows/Linux …