Download
1 / 30
310 likes | 452 Views
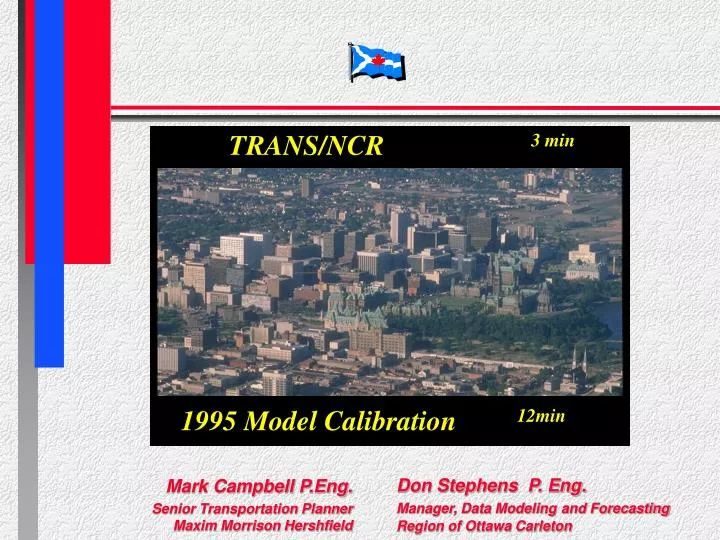
TRANS/NCR 3 min. Technical Session 4 – Model Development & Calibration 4.1 Calibration of the TRANS Model for the National Capital Region (Ottawa-Hull). 1995 Model Calibration 12min. Don Stephens P. Eng. Manager, Data Modeling and Forecasting Region of Ottawa Carleton.

E N D
TRANS/NCR 3 min Technical Session 4 – Model Development & Calibration 4.1 Calibration of the TRANS Model for the National Capital Region (Ottawa-Hull) 1995 Model Calibration 12min Don Stephens P. Eng. Manager, Data Modelingand Forecasting Region of Ottawa Carleton Mark Campbell P.Eng. Senior Transportation Planner Maxim Morrison Hershfield
A Joint Technical Committee on Transportation Systems Planning in the National Capital Region • regions, transit authorities, provincial ministries and federal government • joint cooperation in areas of common interest • modeling • data collection A Joint Technical Committee on Transportation Systems Planning in the National Capital Region
NOTRE DAME DE LA SALETTE LA PÊCHE L'ANGE- GARDIEN MRC VAL DES PONTIAC BUCKINGHAM CANTLEY MONTS GATINEAU CHELSEA MASSON CUO ROCKCLIFFE PARK HULL AYLMER VANIER CUMBERLAND O KANATA t t WEST a w OTTAWA a R i v e CARLETON r GLOUCESTER NEPEAN RMOC OSGOODE GOULBOURN RIDEAU National Capital Region • POPULATION • 1,100,000 • EMPLOYMENT • 540,000 REGIONAL MUNICIPALITY RMOC OF OTTAWA-CARLETON MUNICIPALITÉ RÉGIONALE DE MRC COMTÉ COLLINES-DE-L'OUTAOUAIS COMMUNAUTÉ URBAINE CUO DE L'OUTAOUAIS NATIONAL CAPITAL REGION A Joint Technical Committee on Transportation Systems Planning in the National Capital Region
Central Area • POPULATION • 60,000 • EMPLOYMENT • 150,000 • NON AUTO MODES • >55% A Joint Technical Committee on Transportation Systems Planning in the National Capital Region
CPR Interprovincial Rideau North Eagleson Green’s Cr Rideau Central Russell/417 CNR West CNR East Greenbelt Traffic Zones/Screenlines ALYMER GATINEAU HULL KANATA OTTAWA ORLEANS BARRHAVEN A Joint Technical Committee on Transportation Systems Planning in the National Capital Region
‘86 Survey 2,297,000 ‘77 Survey 1,569,000 ‘72 Survey 1,438,000 OHATS ’63 871,000 Past Surveys 3,000,000 ‘95 Survey 2,720,000 2,500,000 Trips per Day 2,000,000 1,500,000 Population 1,000,000 Employment 500,000 Dwelling Units 0 1960 1965 1970 1975 1980 1985 1990 1995 2000 A Joint Technical Committee on Transportation Systems Planning in the National Capital Region
Telephone Survey - 21,000 interviews/households - 56,000 persons - 145,000 trips - 5 to 20 % sample Walk Cycle Auto Driver/Passenger Public Transit 1995 NCR OD Survey Sept to Dec’95 T R A N S A Joint Technical Committee on Transportation Systems Planning in the National Capital Region
TRANS MODEL1995 CALIBRATION A Joint Technical Committee on Transportation Systems Planning in the National Capital Region
INTER- MODAL ZONAL SPLIT TRIPS MODEL TRIP GENERATION TRIP ASSIGNMENT (PM PEAK DISTRIBUTION PERIOD) PEAK HOUR INTRA- OBSERVED FACTORS BY ZONAL EXTERNAL MODE SPLIT TRIP PURPOSE TRIPS TRIP TABLE 1995 TRANS MODEL A Joint Technical Committee on Transportation Systems Planning in the National Capital Region
NETWORK INNOVATIONS • Network outside Greenbelt expanded in detail • Auto volume delay functions based on posted speed and road capacity • Transit volume delay functions dependant on auto speeds along shared links • Macros convert ultimate network to 1995 and 2021 networks A Joint Technical Committee on Transportation Systems Planning in the National Capital Region
AUTO VOLUME DELAY FUNCTIONS Posted Nominal Capacity .... Speed 400 600 800 1000 800 .... 20 22 32 42 52 .... 30 23 33 43 53 .... 40 24 34 44 54 .... 25 35 45 55 45 50 50 .... 60 26 36 46 56 .... 70 27 37 47 57 .... .... .... .... .... .... convention is fd ( capacity/2 ) ( first digit of posted speed ) fd45 = 50 *60/(length*1.3 )* (1+ .6 * ((volau + volad)/ (lanes* 800))^4) A Joint Technical Committee on Transportation Systems Planning in the National Capital Region
ttf 70 = auto time on link * 1.6(transit route shared with private vehicles) ttf 73 = auto time on link * 2.5( several CBD routes) TRANSIT VOLUME DELAY FUNCTIONS • ttf 71 = (length/15) * 60( bus only lanes with 15 kph along the roadway) • ttf 72 = (length/48) * 60( transitway links with average speed of 48 kph) • ttf 74 = (length/70) * 60( bus-only lanes along highways, average speed 70 kph) A Joint Technical Committee on Transportation Systems Planning in the National Capital Region
0.97 .446 * EMP(other) Ottawa and Hull central areas PRODUCTION .390 * EMP(other) Ontario 0.94 .433 * EMP(other) Quebec 0.91 Ottawa and Hull central areas 0.97 .178 * POP 25-44 + .192 * POP 45-64 ATTRACTION 0.98 .348 * POP 25-44 + .258 * POP 45-64 Ontario 0.99 .405 * POP 25-44 + .117 * POP 45-64 Quebec PRODUCTION .142 * OD_SCHS 0.59 0.77 ATTRACTION .07072 * POP 15-24 + .121 * POP 10 -14 TRIP GENERATION EQUATIONS Trip Purpose Regression Equation R^2 Work to Home Secondary School to Home EMP (other): total employment minus retail employment Pop 25-44: population in age cohort OD_SCHS: secondary school enrollment A Joint Technical Committee on Transportation Systems Planning in the National Capital Region
Trip Purpose Post Sec_ Sch PRODUCTION .117 * POST_SEC_ENROLLMENT 0.96 to Home ATTRACTION .074 * POP15-24 + .0059 * POP25-44 0.83 PRODUCTION .052 * POP + .0711 * EMP + 1.947 * GLA 0.85 Other to Home ATTRACTION .115 * POP 0.96 PRODUCTION .0542 * DWEL + .176 * EMP + .578 * GLA 0.93 Non Home Based ATTRACTION .0902 * EMP + .128 * DWEL + 1.69 * GLA 0.89 PRODUCTION .187 * DWEL 0.9 Leave Home ATTRACTION .062 * EMP + 1.06 * GLA 0.57 TRIP GENERATION EQUATIONSCONT... Regression Equation R^2 A Joint Technical Committee on Transportation Systems Planning in the National Capital Region
TRIP GENERATION (1995 LAND USE) PM Peak Period Trips PM Peak Hour Factors PM Peak Hour Trips Trip Purpose Work to Home Production 163,000 81,800 0.502 Attraction 162,000 81,300 SSch to Home Production 3,700 16,600 0.224 Attraction 3,700 16,700 Post SSch to Home 9,000 3,100 Production 0.347 3,800 Attraction 11,000 Other to Home Production 108,000 46,800 0.433 Attraction 110,000 47,600 Production 108,000 47,500 Non Home Based 0.440 Attraction 111,000 48,800 Leave Home 70,000 Production 28,000 0.400 42,000 Attraction 16,800 Total Production 474,600 210,900 Attraction 452,700 202,000 A Joint Technical Committee on Transportation Systems Planning in the National Capital Region
Gravity • 2 Dimensional • 4 Equations - Ontario to Ontario - Ontario to Quebec - Quebec to Quebec - Quebec to Ontario Gravity Model, Same Style as the Work to Home Model TRIP DISTRIBUTION MODEL Work to Home Remaining Trip Purposes A Joint Technical Committee on Transportation Systems Planning in the National Capital Region
MODAL SPLIT MODEL • 2 Modes - Auto Persons & Auto Vehicles - Transit - Work to Home (UTA) - School to Home (UTA) • Logit Model • Diversion Curves - All Other Trips A Joint Technical Committee on Transportation Systems Planning in the National Capital Region
Auto cost -- Consists of fuel consumption and a parking cost in cents. Transit fare -- Transit fare in cents Veh/household -- Has three groups, 0 for no vehicle/hh, 1 for 1 vehicle/hh, 2 for more than 1 vehicle per household. Province -- 0 for Ontario and 1 for Quebec residents. Travel Time -- Time in minutes to travel from trip origin to trip destination. Auto Time +10% Auto Cost +10% % Change in Auto Mode Split Transit Time +10% Veh/HH from 1 to 2+ Transit Fare +10% -6% -4% -2% 0% 2% 4% 6% 8% HOME BASED WORK TRIP LOGIT MODEL Number of Vehicles Mode Trip Cost Total Travel Time Province Constant per Household Auto Person -0.008641 -0.0096 Transit -0.008641 -0.0096 -1.738 -0.8367 0.9091 Changing the variables will in turn change the auto person modal split to... A Joint Technical Committee on Transportation Systems Planning in the National Capital Region
Out of vehicle -- 0 for auto mode, For transit, total travel time less in vehicle travel time. Veh/household -- Has three groups, 0 for no vehicle/hh, 1 for 1 vehicle/hh, 2 for more than 1 vehicle per household. Province -- 0 for Ontario and 1 for Quebec residents. Transit Out Of Vehicle Travel Time +10% % Change in Auto Mode Split Vehicle/HH From 1 to 2+ -4% -3% -2% -1% 0 % 1 % 2 % 3 % SCHOOL TO HOME LOGIT MODEL Out of Vehicle Number of Vehicles Mode Province Constant Travel Time per Household Auto Person Transit -0.0926 -1.083 -0.527 2.85 Changing the variables will in turn change the auto person modal split to... A Joint Technical Committee on Transportation Systems Planning in the National Capital Region
Auto Person Mode Choice Non Work Trips, UTA - (Auto Time 0-15 Min) 1.00 0.95 0.90 Auto Mode Split = 1.052 - 0.26 * (1/Transit / Auto Time) 0.85 Auto Mode Split R^2= .91 0.80 Auto Person Trips 77,800 Transit Person trips 6,300 0.75 0.70 Observed 0.65 Linear (Observed) 0.60 1.3 1.4 1.5 1.6 1.7 1.9 2.1 2.4 2.7 3.1 3.6 Transit / Auto Time A Joint Technical Committee on Transportation Systems Planning in the National Capital Region
2.7 1.6 1.7 1.8 1.9 2.0 2.1 2.2 23 2.4 2.5 2.6 Auto Person Mode Choice Non Work Trips, UTA - (Auto Time +15 Min) 1.00 0.98 0.96 0.94 Auto Mode Split Auto Mode Split = 1.071 - 0.249 * (1/Transit / Auto Time) 0.92 R^2= .71 0.90 Auto Person Trips 22,500 Transit Person trips 600 0.88 Observed 0.86 Linear (Observed) 0.84 Transit / Auto Time A Joint Technical Committee on Transportation Systems Planning in the National Capital Region
AUTO OCCUPANCY EQUATIONS Trips being Modelled Equation R Squared UTA* Work 1.25 - .00259 * distance 0.251 Other 1.25 + .001186 * distance 0.127 School 3.67 - .7481 * ln(distance) 0.84 OUTSIDE UTA** Work 1.071 + .00275 * distance 0.55 Other 1.296 - .00187 * distance 0.18 School 3 estimated * UTA Trips with origin and destination in urban transit area ** Outside UTA Trips with origin and/or destination outside the urban transit area A Joint Technical Committee on Transportation Systems Planning in the National Capital Region
Transit Auto Person Trip Total Persons Auto Vehicle Trips Purpose Trips Trips Trips Work - OD Survey 78,800 59,600 19,200 49,200 Model 81,300 61,700 19,600 49,200 3,730 School - OD Survey 7,390 3,670 1,710 3,580 3,850 Model 7,430 1,640 116,900 7,960 Other - OD Survey 124,900 93,400 118,100 7,860 89,300 Model 125,900 193,000 30,900 155,200 Total - OD Survey 223,900 196,200 31,300 150,900 Model 227,500 MODAL SPLIT RESULTS(INCLUDES EXTERNAL TRIPS) A Joint Technical Committee on Transportation Systems Planning in the National Capital Region
0 2000 4000 6000 8000 10,000 12,000 14,000 16,000 18,000 1995 PEAK HOUR ASSIGNMENT (Outbound - Model Vs. Observed Counts) Rideau River CPR Ottawa Central Rideau Canal Fallowfield Eagleson Green Creek CNR West/ Acres CNR East Western Parkway Leitrim/ Ramsayville +6% 0% +17% +1% -1% • Model Overestimation • Model Underestimation -7% +15% -4% -17% -9% -12% A Joint Technical Committee on Transportation Systems Planning in the National Capital Region
0 2000 4000 6000 8000 10,000 12,000 14,000 16,000 18,000 1995 PEAK HOUR ASSIGNMENT (Outbound - Model Vs. Observed Counts) +31% Rideau River CPR Ottawa Central Rideau Canal Fallowfield Eagleson Green Creek CNR West/ Acres CNR East Western Parkway Leitrim/ Ramsayville +6% +13% 0% -3% +17% -23% +1% -4% -1% • Model Overestimation • Model Underestimation +31% -7% -11% +15% -2% -4% • Transit • Auto Vehicle +17% -17% +5% -9% -40% -12% A Joint Technical Committee on Transportation Systems Planning in the National Capital Region
0 200,000 400,000 600,000 800,000 1,000,000 1,200,000 1,400,000 Change in Demographics 1995 to 2021 Population (5 yrs and over) Dwelling Units Total Employment Gross Leasable Area (in 100 ft2) +44% +50% +55% +40% A Joint Technical Committee on Transportation Systems Planning in the National Capital Region
0 20,000 40,000 60,000 80,000 100,000 120,000 140,000 160,000 180,000 1995 and 2021 Travel Demand Total Auto Person Trips +30% Work +55% Other A Joint Technical Committee on Transportation Systems Planning in the National Capital Region
0 20,000 40,000 60,000 80,000 100,000 120,000 140,000 160,000 180,000 1995 and 2021 Travel Demand Total Auto Person Trips and Transit Trips +30% Work • Transit • Auto Persons +55% +120% +55% Other A Joint Technical Committee on Transportation Systems Planning in the National Capital Region
QUESTIONS ? A Joint Technical Committee on Transportation Systems Planning in the National Capital Region Don Stephens P. Eng. Manager, Data Modelingand Forecasting Region of Ottawa Carleton Mark Campbell P.Eng. Senior Transportation Planner Maxim Morrison Hershfield
A Joint Technical Committee on Transportation Systems Planning in the National Capital Region QUESTIONS ? A Joint Technical Committee on Transportation Systems Planning in the National Capital Region