Download
1 / 32
320 likes | 429 Views
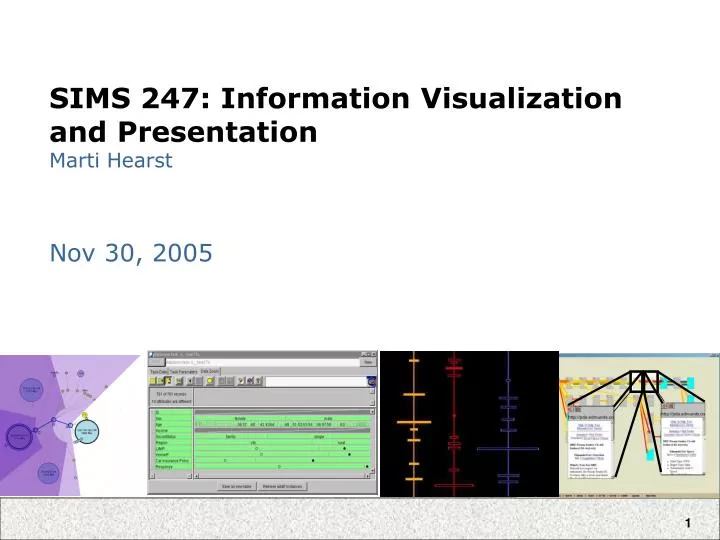
SIMS 247: Information Visualization and Presentation Marti Hearst. Nov 30, 2005. Today . Evaluating Infoviz What are the goals of evaluation? How to do usability evaluations Two examples: Graph viz comparison (nodes & links vs matrix) Tree navigation (explorer vs. hyperbolic tree)

E N D
SIMS 247: Information Visualization and PresentationMarti Hearst Nov 30, 2005
Today • Evaluating Infoviz • What are the goals of evaluation? • How to do usability evaluations • Two examples: • Graph viz comparison (nodes & links vs matrix) • Tree navigation (explorer vs. hyperbolic tree) • Focus on conflating factors • Ideas for evaluating class projects
Why do Evaluation? • To tell how good or bad a visualization is • People must use it to evaluate it • To compare against the status quo • Something that looks useful to the designer might be too complex or superfluous for real users • For iterative design • Interface might be almost right but require adjustments • The interactive components might have problems • To advance our knowledge of how people understand and use technology
Usability Test vs. Controlled Experiment • Usability test: • Formative: helps guide design • Single UI, early in design process • Few participants • Identif y usability problems, incidents • Qualitative feedback from users • Controlled experiment: • Summative: measure final result • Compare multiple UIs • Many participants, strict protocol • Independent & dependent variables • Quantitative results, statistical significance Slide adapted from Chris North's
Controlled Experiments Slide adapted from Chris North's
Scientific Method • Form Hypothesis • Collect data • Analyze • Accept/reject hypothesis How to “prove” a hypothesis in science? • Easier to disprove things, by counterexample • Null hypothesis = opposite of hypothesis • Disprove null hypothesis • Hence, hypothesis is proved Slide adapted from Chris North's
Empirical Experiment Typical question: Which visualization is better in which situations? Spotfire vs. TableLens Slide adapted from Chris North's
Cause and Effect • Goal: determine “cause and effect” • Cause = visualization tool (Spotfire vs. TableLens) • Effect = user performance time on task T • Procedure: • Vary cause • Measure effect • Problem: random variation • Cause = vis tool OR random variation? Slide adapted from Chris North's
Variables • Independent Variables (what you vary), and treatments (the variable values): • Visualization tool • Spotfire, TableLens, Excel • Task type • Find, count, pattern, compare • Data size (# of items) • 100, 1000, 1000000 • Dependent Variables (what you measure) • User performance time • Errors • Subjective satisfaction (survey) Slide adapted from Chris North's
Example: 2 x 3 design Ind Var 2: Task Type • n users per cell Ind Var 1: Vis. Tool Measured user performance times (dep var) Slide adapted from Chris North's
Groups • “Between subjects” variable • 1 group of participants for each variable treatment • Group 1: 20 participants, Spotfire • Group 2: 20 participants, TableLens • Total: 40 participants, 20 per cell • “With-in subjects” (repeated) variable • All participants perform all treatments • Counter-balancing order effect • Group 1: 20 participants, Spotfire then TableLens • Group 2: 20 participants, TableLens then Spotfire • Total: 40 users, 40 per cell Slide adapted from Chris North's
Selecting Tasks • Should reflect what real tasks will be like • may need to shorten if • they take too long • require background that test user won’t have • Be sure tasks measure something directly related to your design • But don’t bias the tasks so that only your design can win • should be a realistic task in order to avoid this • Don’t choose tasks that are too fragmented
Special Considerations for Evaluating Visualizations • Be careful about what is being compared • Example of how to do it wrong: • One study compared a web path history visualization that had • thumbnails • fisheye properties • hierarchical layout • against the Netscape textual history list • Problem: • too many variables changed at once! • can’t tell which of the novel properties caused the effects
Important Factors • Perceptual abilities • spatial abilities tests • colorblindness • handedness (lefthanded vs. righthanded)
Procedure • For each participant: • Sign legal forms • Pre-Survey: demographics • Instructions • Training runs • Actual runs • Give task, measure performance • Post-Survey: subjective measures Slide adapted from Chris North's
Usability Testing Slide adapted from Chris North's
Usability Specification Table Slide adapted from Chris North's
Usability Test Setup • Set of benchmark tasks • Easy to hard, specific to open-ended • Coverage of different UI features • E.g. “find the 5 most expensive houses for sale” • Experimenters: • Facilitator: instructs user • Observers: take notes, collect data, video tape screen • Executor: run the prototype if low-fi • Participants • 3-5; quality not quantity Slide adapted from Chris North's
“Think Aloud” Method • This is for usability testing, not formal • Need to know what users are thinking, not just what they are doing • Ask participants to talk while performing tasks • tell us what they are thinking • tell us what they are trying to do • tell us questions that arise as they work • tell us things they read • Make a recording or take good notes • make sure you can tell what they were doing
Thinking Aloud (cont.) • Prompt the user to keep talking • “tell me what you are thinking” • Try to only help on things you have pre-decided to help with • keep track of anything you do give help on • if participant stuck or frustrated, then end the task (gracefully) or help them
Pilot Study • Goal: • help fix problems with the study • make sure you are measuring what you mean to be • Procedure: • do twice, • first with colleagues • then with real users • usually end up making changes both times
Usability Test Procedure • Goal: mimic real life • Do not cheat by showing them how to use the UI! • Initial instructions • “We are evaluating the system, not you.” • Repeat: • Give participant a task • Ask participant to “think aloud” • Observe, note mistakes and problems • Avoid interfering, hint only if completely stuck • Interview • Verbal feedback • Questionnaire • ~1 hour / participant (max) Slide adapted from Chris North's
Data • Note taking • E.g. “&%$#@ user keeps clicking on the wrong button…” • Verbal protocol: think aloud • E.g. user expects that button to do something else… • Rough quantitative measures • e.g. task completion time, .. • Interview feedback and surveys • Video-tape screen & mouse Slide adapted from Chris North's
Analyze • Initial reaction: • “stupid user!”, “that’s developer X’s fault!” • Mature reaction: • “how can we redesign UI to solve that usability problem?” • the user is always right • Identify usability problems • Learning issues: e.g. can’t figure out or didn’t notice feature • Performance issues: e.g. arduous, tiring to solve tasks • Subjective issues: e.g. annoying, ugly • Problem severity: critical vs. minor Slide adapted from Chris North's
Cost-Importance Analysis • Importance 1-5: (task effect, frequency) • 5 = critical, major impact on user, frequent occurance • 3 = user can complete task, but with difficulty • 1 = minor problem, small speed bump, infrequent • Ratio = importance / cost • Sort by this • 3 categories: Must fix, next version, ignored Slide adapted from Chris North's
Refine UI • Simple solutions vs. major redesigns • Solve problems in order of: importance/cost • Example: • Problem: user didn’t know he could zoom in to see more… • Potential solutions: • Better zoom button icon, tooltip • Add a zoom bar slider (like moosburg) • Icons for different zoom levels: boundaries, roads, buildings • NOT: more more “help” documentation!!! You can do better. • Iterate • Test, refine, test, refine, test, refine, … • Until? Meets usability specification Slide adapted from Chris North's
Study Example Mohammad Ghoniem, Jean-Daniel Fekete, Philippe Castagliola. A Comparison of the Readability of Graphs Using Node-Link and Matrix-Based Representations. InfoVis 2004, Austin, TX, Oct 2004. IEEE
Nodes & Links vs. Matrix • Initial studies led to a design modification • Added in color highlighting of moused-over and selected nodes • Needed this because participants became frustrated initial study without them • Looked at a set of typical graph operations • Varied graphs by # of nodes and connectivity • Found that matrix better for all tasks except path following • Better here means faster and higher accuracy on average
Study Example Peter Pirolli, Stuart K. Card, and Mija Van Der Wege. The Effect of Information Scent on Searching Information Visualizations of Large Tree Structures. AVI 2000, Palermo, Italy.
Main Conclusions • Results of the Browse-Off were a function of the types of tasks, the structure of the information, and the skills of the participants • NOT the difference in the browsers • The Hyperbolic Browser can be faster when • The clues about where to go next are clear • The tasks are relatively simple
Lessons for Study Design • This paper contains a wealth of good ideas about how to • Isolate what’s really going on • Assess and understand the data
Assessing Infoviz Projects • How does all this apply to you?