Download
1 / 113
1.13k likes | 1.25k Views
Achievement In America. WHERE ARE WE NOW? Key Facts on the Achievement Gap. Elementary Literacy Middle School Math Literacy. Where Are We Now? 4th Grade Reading All Students 2003. Source: USDOE, NCES, National Assessment of Educational Progress (NAEP) Summary Data Tables.

E N D
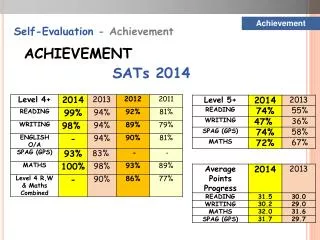
WHERE ARE WE NOW? Key Facts on the Achievement Gap Elementary Literacy Middle School Math Literacy
Where Are We Now?4th Grade Reading All Students 2003 Source: USDOE, NCES, National Assessment of Educational Progress (NAEP) Summary Data Tables
Where Are We Now?8th Grade Math All Students 2003 Source: USDOE, NCES, National Assessment of Educational Progress (NAEP) Summary Data Tables
Underneath those nation-wide figures, there are gaps of all sorts…including: gaps among states Source: USDOE, NCES, National Assessment of Educational Progress (NAEP) Summary Data Tables
2003 Grade 4 NAEP Reading All Source: USDOE, NCES, National Assessment of Educational Progress (NAEP)
2003 Grade 8 NAEP Math All Source: USDOE, NCES, National Assessment of Educational Progress (NAEP)
By Race, Ethnicity NAEP 4th Grade Reading 2003 Source: USDOE, NCES, National Assessment of Educational Progress (NAEP)
By Race, Ethnicity NAEP 8th Grade Math 2003 Source: USDOE, NCES, National Assessment of Educational Progress (NAEP)
By Family Income NAEP 4th Grade Reading 2003 (Nation) Source: USDOE, NCES, National Assessment of Educational Progress (NAEP)
By Family Income NAEP 8th Grade Math 2003 (Nation) Source: USDOE, NCES, National Assessment of Educational Progress (NAEP)
Gaps Narrow, Then Hold Steady or Widen: NAEP Math Scores, 13 Year-Olds Source: US Department of Education, National Center for Education Statistics. NAEP 1999 Trends in Academic Progress (p. 108) Washington, DC: US Department of Education, August 2000
Gaps Narrow, Then Mostly Widen NAEP Reading, 17 Year-Olds Source: US Department of Education, National Center for Education Statistics. NAEP 1999 Trends in Academic Progress (p. 107) Washington, DC: US Department of Education, August 2000
Too Few 17 Year-Olds Demonstrate Strong Reading Skills Source: USDOE, NCES, 1999 NAEP Summary Data Tables
Too Few 17 Year-Olds Demonstrate Strong Math Skills Source: USDOE, NCES, 1999 NAEP Summary Data Tables
African American and Latino 17 Year Olds Have Been Taught Math to the Same Levels as White 13 Year Olds Source: NAEP 1999 Long Term Trends Summary Tables (online)
African American and Latino 17 Year Olds Have Been Taught to Read to the Same Levels as White 13 Year Olds Source: Source: NAEP 1999 Long Term Trends Summary Tables (online)
Students Graduate From High School At Different Rates Source: US Bureau of Census, Current Population Reports, Educational Attainment in the United States: March 1998 (p. 20-513), Detailed Tables No. 2
U.S. students competitive in the early grades, But fall behind by the end of high school
Source: NCES, Highlights From TIMSS 1999 http://nces.ed.gov/timss/results.asp
Source: NCES, Highlights From TIMSS 1999 http://nces.ed.gov/timss/results.asp
U.S. Ranks 24th out of 29 OECD Countries in Mathematics Source: Organization for Economic Cooperation and Development (OECD), PISA 2003 Results, data available at http://www.oecd.org/
U.S. Ranks 24th out of 29 OECD Countries in Problem-Solving Source: Organization for Economic Cooperation and Development (OECD), PISA 2003 Results, data available at http://www.oecd.org/
U.S. Ranks 15th out of 29 OECD Countries in Reading Source: Organization for Economic Cooperation and Development (OECD), PISA 2003 Results, data available at http://www.oecd.org/
To Make Matters Worse, HS Completion Declining • Proportion of students getting h.s. diploma declining; • Number opting for GED increasing; • U.S. slips from 1st in the world in h.s. completion to 14th
U.S. Ranks 14th in High School Graduation Rates (2001) Source: Organization for Economic Cooperation and Development (OECD), Education at a Glance: OECD Indicators 2003 Edition, data available at http://www.oecd.org/
Not surprisingly, the consequences of the achievement gap reach beyond high school
Highest Achieving Low-Income Students Attend Postsecondary at Same Rate as Bottom Achieving High Income Students Source: NELS: 88, Second (1992) and Third Follow up (1994); in, USDOE, NCES, NCES Condition of Education 1997 p. 64
Source: 2002 NCAA Division I Graduation Rates Report http://www.ncaa.org/
High School Completers Who Were Enrolled in College the October After Completing High School, By Family Income (2001) Source: USDE, NCES. The Condition of Education 2003, NCES 2003-067.
Bachelor’s or Higher Degree byAge 26 * SES= Socio Economic Status Source: National Center for Education Statistics Statistical Analysis Report, Coming of Age in the 1990s: The Eighth-Grade Class of 1988 12 Years Later, U.S. Department of Education Office of Educational Research and Improvement; June 2002.
Of Every 100 White Kindergartners: (25-to 29-Year-Olds) Source: US Department of Commerce, Bureau of the Census. March Current Population Surveys, 1971-2001, in The Condition of Education 2002.
Of Every 100 African American Kindergartners: (25-to 29-Year-Olds) Source: US Department of Commerce, Bureau of the Census. March Current Population Survey, 1971-2001, In The Condition of Education 2002.
Of Every 100 Latino Kindergartners: (25-to 29-Year-Olds) Source: US Department of Commerce, Bureau of the Census. March Current Population Surveys, 1971-2001, In The condition of Education 2002.
It doesn’t have to be this way! Poor and Minority childrenwill rise to the challenge when it’s presented to them
Poor and Minority students ARE succeedingin some schools ...
Centennial Place Elementary SchoolAtlanta, Georgia • 92% African American • 64% Low Income • Performed in the top 2% of all Georgia schools in 4th grade reading in 2003 • Performed in top 7 % of Georgia schools in 4th grade math in 2003 Source: Georgia Department of Education, http://www.doe.k12.ga.us Dispelling the Myth Online, http://www.edtrust.org School Information Partnership, http://www.schoolresults.org
High Achievement at Centennial Place2004 Reading Composite Source: Georgia Department of Education, http://www.doe.k12.ga.us
High Achievement at Centennial Place2004 Math Composite Source: Georgia Department of Education, http://www.doe.k12.ga.us
Lapwai ElementaryLapwai, ID • 75% Native American • 21% White • 69% Low-income • Outperformed the state in 4th grade reading and math in 2003 • Native American students outscored all students in the state in 4th grade reading and math in 2003