Download
1 / 73
730 likes | 1.05k Views
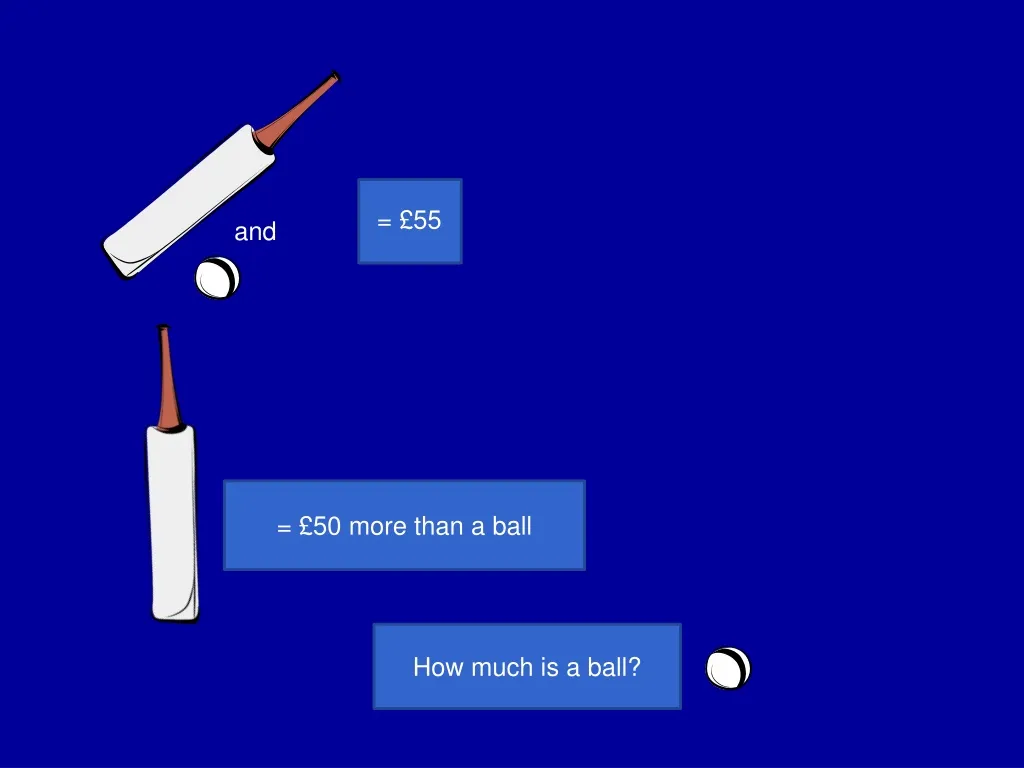
= £55. and. = £50 more than a ball. How much is a ball?. “ Are people good intuitive statisticians ? …

E N D
= £55 and = £50 more than a ball How much is a ball?
“Are people good intuitive statisticians? … …expert colleagues, like us, greatly exaggerated the likelihood that the original result of an experiment would be successfully replicated even with a small sample. They also gave very poor advice to a fictitious graduate student about the number of observations she needed to collect. Even statisticians were not good intuitive statisticians.”
Introduction to Statistical Considerations in Experimental Research Dr. Richy Hetherington and Dr. Kim Pearce
Important messages early • Statistical Support is available for your needs • Get advice at the right time • Keep it simple • Set up your tests to get noteworthy results • p < 0.05 is not essential for reporting interesting results
An Experiment “The action of trying anything, or putting it to proof; a test, trial” Oxford English Dictionary My Life as a Turkey Book Illumination in the Flatwoods Joe Hutto
Support for broader applied health research methods • For students with social or health research • Signposting with • Surveys • Interviews • Qualitative methods • Tuesday 11/11/2014 (10:00 - 12:00) Dr Justin Presseau
Today’s Session • Start a live experiment • Discussion of considerations when setting up experiments • Analyse the results of our experiments with thoughts on what to look out for • The best help for you
Write down you answer And get ready for the next screen
That was an easy one This ones not too bad either, gotta chew!
Take a breath And write down your answer, remember the idea is not to think about it. Tricky one this time
Are you confident you’re doing well? Get ready for the next one
That’s half way Well done get ready for the next screen
That was too easy again Another hard one this time
Nearly finished now Just 2 to go keep watching and writing down the numbers
Results • Now how do we analyse the results? • FIRST MAKE A GUESS OF THE TOTAL HOW MANY YOU ARE OUT BY AND WRITE IT ON THE BACK
Results • Unfold the sheet • Find the difference between your guess and the real answer (take the smallest number from the biggest) • Write it in the final column • Add all the numbers in the last column • That will be your ‘coefficient of unconscious counting’
A New Hypothesis • Men are more confident about their numerical guesses than women. • Less chance of error • Maybe more chance of significance ?!
Take Home Messages • Leave no stone unturned(use all possible sources of information) • Training to help (workshops throughout the year): Library Databases Robust search Methodologies for Literature Review Systematic Review Alerting Services Advanced Medline • Think about what is coming next
Planning Your Experiments Take home message . Don’t believe everything you read & Introduction to Critical Appraisal (online) Academic Integrity and Plagiarism Use non-rigorous experiments but be prepared to repeat them with rigour Take home message. Get as much help as is available in setting up your experiments (shy bairns get nowt!)
Make every result count Take home message . Set up your experiments so all eventualities are interesting Results can be meaningful and interesting without being statistically significant Also reporting non-significant findings avoids others from needlessly repeating that experiment
Subject Selection and Randomisation • Make sure the sample you take is representative of what you are testing • Samples should be made randomly to avoid bias e.g. are you a representative sample of the population. If I want more left handed people for my experiment how should I find them?
Replication • Combining datasets from separate experiments is difficult • Datasets can be treated as replicates if all other variables are the same or weighted • Analysis of replicates indicate the amount of variation in a result
Controls • Controls should give you internal validity • Take as much care with controls as with samples • Each experiment requires its own control
Why have small sample sizes Non-Human Primates often n=1 Very rare conditions the population is small Animal experimentation
Get a statisticians help now • “To call in the statistician after the experiment is done may be no more than asking him to perform a post-mortem examination: he may be able to say what the experiment died of.”Dr. R. A. Fisher ca1938
Males vs FemalesThe 2 sample t-test (Parametric Test) • Subjects (units) are usually randomly assigned to two groups. One of the groups undergoes experimental manipulation (e.g. has a treatment applied), the other group is the control. • In many examples, however, two groups are compared where membership is ‘fixed’ e.g. males vs females, left vs right handed etc. • We are testing if the two population means are equal. • The 2 sample t-test statistic makes use of • the difference between (average) value of male and female groups, • the (pooled) standard deviation, and • the size of the male and female groups. (We do not have to have equal numbers in our groups) • We compare the value of the statistic to a statistical distribution. The significance of the statistic is obtained and is expressed by a ‘p value’. • When p is < 0.05 we say that the statistic is statistically significant i.e. in this case, there is evidence that the male group is different to the female group (in the population).
Result using the data available • Do males and females differ? • P=? • Let’s look at the data on a plot.
Using smaller samples • 5 males and 5 females were randomly chosen and the 2 sample t-test was again carried out. • Is there evidence that the male group is different to the female group (in the population)? • As the group size is small, there is a reduced chance of observing a difference between the male and female groups when we conduct the test.
What is the power of these tests? • We would like our test to have high power which means that the test will detect a difference when it truly exists. • The power of the test is influenced by different things including sample size. • The lower sample size of our 2nd test (using 5 males and 5 females) means that the test’s power has been reduced.
Power of Our tests Test 1 (large sample sizes). Power = Test 2 (5 males, 5 females). Power=
What influences the power of a test? • As variation in the sample increases, power decreases. • As the difference we care about decreases, power decreases. • As sample size decreases, power decreases.