Download
1 / 1
20 likes | 161 Views
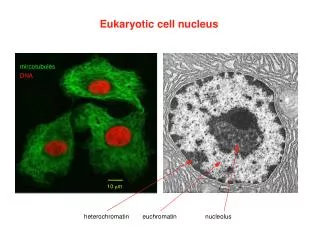
B. A. Cyan. caffeine. 200. 180. Intensity, a.u. 160. Time, s. 140. 0. 50. 100. 150. Yellow. 0. -5. D R/R0*100, %. -10. -15. 20 m m. Supplemental Figure. A , XY images of ventricular myocyte 48 ours after infection with

E N D
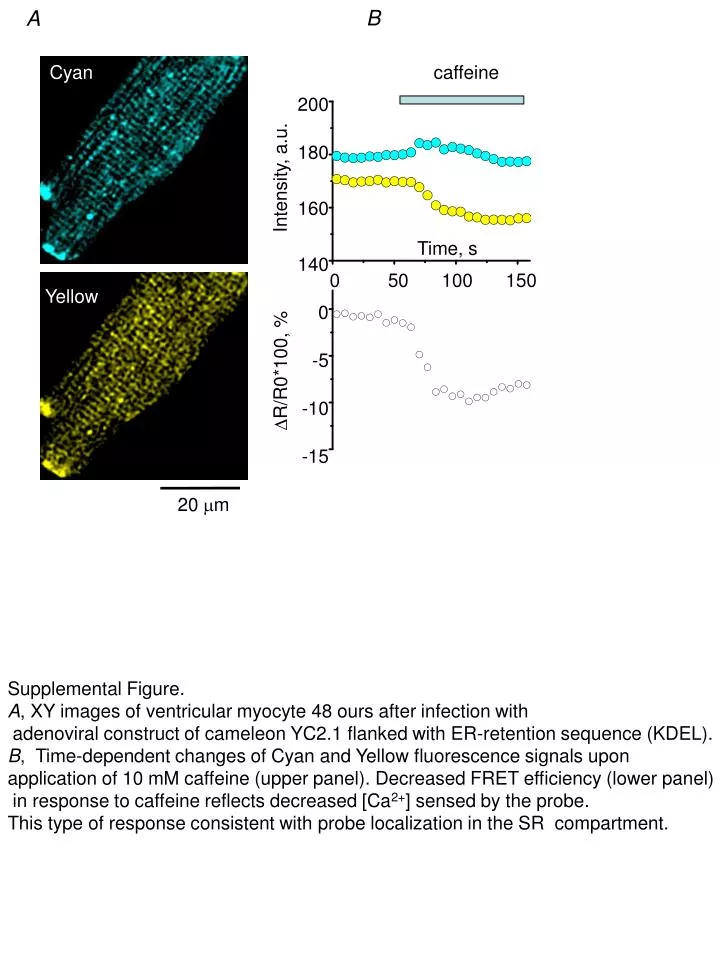
B A Cyan caffeine 200 180 Intensity, a.u. 160 Time, s 140 0 50 100 150 Yellow 0 -5 DR/R0*100, % -10 -15 20 mm Supplemental Figure. A, XY images of ventricular myocyte 48 ours after infection with adenoviral construct of cameleon YC2.1 flanked with ER-retention sequence (KDEL). B, Time-dependent changes of Cyan and Yellow fluorescence signals upon application of 10 mM caffeine (upper panel). Decreased FRET efficiency (lower panel) in response to caffeine reflects decreased [Ca2+] sensed by the probe. This type of response consistent with probe localization in the SR compartment.