Download
1 / 1
10 likes | 86 Views
DOCUMENT OUTCOMES. 2. 1. 20y. 45y. 50y. 75y +. DERIVE MEASURES OF WEIGHT STATUS. 3. 20. 20. 25. 25. 30. 30. 35. 35. 40. 40. 45. 45. WORK IN PROGRESS.

E N D
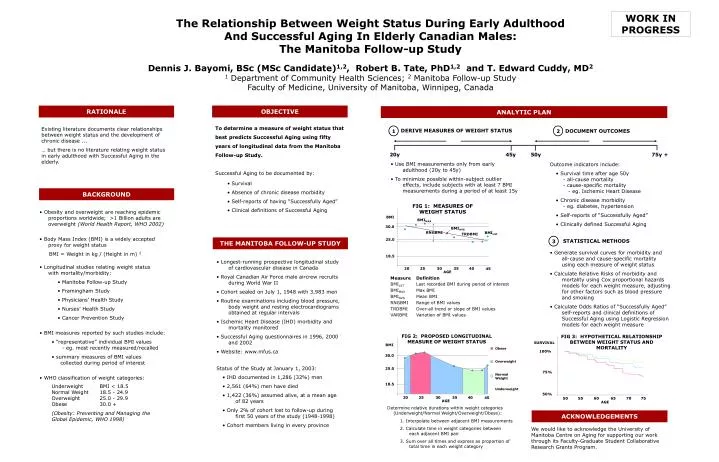
DOCUMENT OUTCOMES 2 1 20y 45y 50y 75y + DERIVE MEASURES OF WEIGHT STATUS 3 20 20 25 25 30 30 35 35 40 40 45 45 WORK IN PROGRESS The Relationship Between Weight Status During Early Adulthood And Successful Aging In Elderly Canadian Males:The Manitoba Follow-up Study Dennis J. Bayomi, BSc (MSc Candidate)1,2, Robert B. Tate, PhD1,2 and T. Edward Cuddy, MD2 1 Department of Community Health Sciences; 2 Manitoba Follow-up Study Faculty of Medicine, University of Manitoba, Winnipeg, Canada • Existing literature documents clear relationshipsbetween weight status and the development of chronic disease ... • … but there is no literature relating weight statusin early adulthood with Successful Aging in the elderly. To determine a measure of weight status that best predicts Successful Aging using fifty years of longitudinal data from the Manitoba Follow-up Study. Successful Aging to be documented by: • Survival • Absence of chronic disease morbidity • Self-reports of having “Successfully Aged” • Clinical definitions of Successful Aging OBJECTIVE RATIONALE ANALYTIC PLAN • Use BMI measurements only from early adulthood (20y to 45y) • To minimize possible within-subject outlier effects, include subjects with at least 7 BMI measurements during a period of at least 15y • Outcome indicators include: • Survival time after age 50y - all-cause mortality - cause-specific mortality - eg. Ischemic Heart Disease • Chronic disease morbidity - eg. diabetes, hypertension • Self-reports of “Successfully Aged” • Clinically defined Successful Aging • Obesity and overweight are reaching epidemic proportions worldwide; >1 Billion adults are overweight (World Health Report, WHO 2002) • Body Mass Index (BMI) is a widely accepted proxy for weight status • BMI = Weight in kg / (Height in m) 2 • Longitudinal studies relating weight status with mortality/morbidity: • Manitoba Follow-up Study • Framingham Study • Physicians’ Health Study • Nurses’ Health Study • Cancer Prevention Study • BMI measures reported by such studies include: • “representative” individual BMI values - eg. most recently measured/recalled • summary measures of BMI values collected during period of interest • WHO classification of weight categories: Underweight BMI < 18.5 Normal Weight 18.5 - 24.9 Overweight 25.0 - 29.9 Obese 30.0 + • (Obesity: Preventing and Managing the Global Epidemic, WHO 1998) BACKGROUND FIG 1: MEASURES OF WEIGHT STATUS BMI BMIMAX 30.0 BMIAVG RNGBMI BMILST TRDBMI 25.0 • Longest-running prospective longitudinal study of cardiovascular disease in Canada • Royal Canadian Air Force male aircrew recruits during World War II • Cohort sealed on July 1, 1948 with 3,983 men • Routine examinations including blood pressure, body weight and resting electrocardiograms obtained at regular intervals • Ischemic Heart Disease (IHD) morbidity and mortality monitored • Successful Aging questionnaires in 1996, 2000 and 2002 • Website: www.mfus.ca • Status of the Study at January 1, 2003: • IHD documented in 1,286 (32%) men • 2,561 (64%) men have died • 1,422 (36%) assumed alive, at a mean age of 82 years • Only 2% of cohort lost to follow-up during first 50 years of the study (1948-1998) • Cohort members living in every province STATISTICAL METHODS THE MANITOBA FOLLOW-UP STUDY • Generate survival curves for morbidity and all-cause and cause-specific mortality using each measure of weight status • Calculate Relative Risks of morbidity and mortality using Cox proportional hazards models for each weight measure, adjusting for other factors such as blood pressure and smoking • Calculate Odds Ratios of “Successfully Aged” self-reports and clinical definitions of Successful Aging using Logistic Regression models for each weight measure 18.5 AGE Measure Definition BMILST Last recorded BMI during period of interest BMIMAX Max BMI BMIAVG Mean BMI RNGBMIRange of BMI values TRDBMIOver-all trend or slope of BMI values VARBMIVariation of BMI values FIG 2: PROPOSED LONGITUDINAL MEASURE OF WEIGHT STATUS FIG 3: HYPOTHETICAL RELATIONSHIP BETWEEN WEIGHT STATUS AND MORTALITY SURVIVAL BMI Obese 100% 30.0 Overweight 25.0 75% NormalWeight 18.5 Underweight 50% 50 55 60 65 70 75 AGE AGE • Determine relative durations within weight categories (Underweight/Normal Weight/Overweight/Obese): • 1. Interpolate between adjacent BMI measurements • 2. Calculate time in weight categories between each adjacent BMI pair • 3. Sum over all times and express as proportion of total time in each weight category ACKNOWLEDGEMENTS We would like to acknowledge the University of Manitoba Centre on Aging for supporting our work through its Faculty-Graduate Student Collaborative Research Grants Program.