Download
1 / 46
460 likes | 519 Views
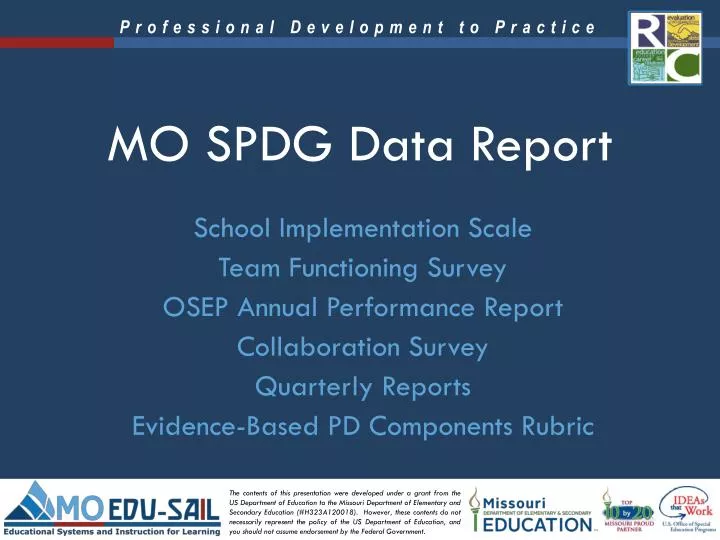
MO SPDG Data Report. School Implementation Scale Team Functioning Survey OSEP Annual Performance Report Collaboration Survey Quarterly Reports Evidence-Based PD Components Rubric. Evaluation Overview. Evaluation data collected for many purposes: Reporting to OSEP

E N D
MO SPDG Data Report School Implementation Scale Team Functioning Survey OSEP Annual Performance Report Collaboration Survey Quarterly Reports Evidence-Based PD Components Rubric
Evaluation Overview Evaluation data collected for many purposes: • Reporting to OSEP • Continuous improvement for schools • Continuous improvement for RPDC providers • Reporting to DESE • Monitoring implementation compliance
School Implementation Scale • 42-item online survey • Assesses implementation in five domains: • Leadership & Empowering Culture • Evidence-Based Instruction, Assessment, & Curriculum • Ongoing Professional Development • Collaborative Data Teaming Processes
School Implementation Scale • 31 items on a Likert Scale: • Six Yes/No Items relating to Collaborative Data Teams
School Implementation Scale • 3,126 respondents in 206 schools • Comparisons with 2013 data based on 2,487 responses from that year
School Implementation Scale Average percent of respondents who answered “Agree” or “Strongly Agree” on items in each domain.
School Implementation Scale STRONG: Administrator commitment (Item 1) WEAK: Time needed to analyze data and problem-solve(Item 17) ACTION ITEM: Work with administrators to increase meeting time allocated to data teams. STRONG: Administrator commitment (Item 1) WEAK: Technology and resources needed for effective instruction (Item 28) ACTION ITEM: Work with administrators to obtain new technology and make resources available to instructional staff. ACTION ITEM: Provide training to help instructional staff identify and effectively utilize existing technology/resources.
School Implementation Scale STRONG: Adapting environment, curriculum, and instruction based on student data (Item 6) WEAK: Evaluate the effectiveness of instruction based on common formative assessment data (Item 20) ACTION ITEM: Ensure that common formative assessment data is being collected at least three times per year. ACTION ITEM: Work with administration to ensure that each teacher is administering common formative assessments. ACTION ITEM: Teach instructional staff how to use common formative assessment data to adapt instruction more effectively.
School Implementation Scale STRONG: Participation in professional development to improve instructional practices(Item 3) WEAK: Receive coaching/mentoring to improve instructional practices(Item 4) ACTION ITEM: Use post-test results to identify areas for follow-up support. ACTION ITEM: Provide in-district coaching to instructional staff to improve instructional practices.
School Implementation Scale STRONG: Collaborative Data Teams are established and meet at least once per month (Item 32) WEAK: CDTs include representatives from all teaching roles (Item 33) ACTION ITEM: Invite additional staff to participate on the Collaborative Data Team, making sure to include general education teachers, special education teachers, and teachers of special classes. STRONG: Three effective practices are identified (Item 36) WEAK: All teachers have been trained to implement the identified effective practices (Item 37) ACTION ITEM: Identify which staff members have not been trained, then provide additional training to these individuals.
School Implementation Scale • Quickly glance through the data. What are your first impressions? • Does the number/role of survey participants adequately represent our schools? • Celebrate successes: Which items or essential elements show high levels of implementation? What processes, professional development, etc. are in place that support these high levels of implementation? • How do the results from the School Implementation Scale align with other school-level data? Is additional data needed? • Prioritize needs: Which essential elements show low levels of implementation? Which survey items highlight areas that could be improved over the next year? • Next steps: How do the results influence our action planning for next year? Blog post: List three action items you might suggest to schools in your region.
Team Functioning Survey • 17-item online survey • Assesses team functioning in three domains: • Structure • Communication • Focus
Team Functioning Survey • 17 items on a Likert Scale:
Team Functioning Survey • 2,927 respondents in 203 schools • Comparisons with 2013 data based on 2,472 responses from that year
Team Functioning Survey Average percent of respondents who answered “Agree” or “Strongly Agree” on items in each domain.
Team Functioning Survey STRONG: Nearly all members attend regularly WEAK: Multiple roles assigned prior to meeting ACTION ITEM: Use the CDTs learning package to provide training on how to assign meeting roles. ACTION ITEM: Work with school teams to create a system of rotating meeting roles (e.g. facilitator, note-taker). STRONG: Agenda created and available WEAK: Minutes/notes taken and distributed ACTION ITEM: Use the CDTs learning package to provide training on how to take and distribute notes. ACTION ITEM: Follow up with school teams to be sure notes are being distributed after meetings.
Team Functioning Survey STRONG: Team members communicate effectively WEAK: Discussions stay on track; no sidebar conversations ACTION ITEM: Use the CDTs learning package to provide training on the roles of Facilitator and Norms Minder. ACTION ITEM: Keep track of how time is spent during a team meeting, including time on task and time spent in sidebar conversations. Review the results with team members and brainstorm strategies to cut down on sidebar conversations.
Team Functioning Survey STRONG: Data drives decision-making WEAK: Status of action items from last meeting are reviewed ACTION ITEM: Use the CDTs learning package to provide training on creating agendas. ACTION ITEM: Be sure each agenda includes time to review the action items from the previous meeting. ACTION ITEM: Use data on the progress made on action items from the previous meeting to determine whether further action is required.
Team Functioning Survey • What is your team most proud of regarding team functioning? • Name one area in which your team needs to improve. • Why is it important to improve this aspect of team functioning? • What will your team do to improve this aspect of team functioning? • Finish this phrase: It is beneficial to look at team functioning because… Blog post: List three steps you can take to help building-level teams improve their team functioning.
SPDG Annual Performance Report • Submitted annually to OSEP • Three main program measures: • Program measure 1: Projects use evidence-based professional development practices to support the attainment of identified competencies. • Program measure 2: Participants in SPDG professional development demonstrate improvement in implementation of SPDG-supported practices over time. • Program measure 3: Projects use SPDG professional development funds to provide follow-up activities designed to sustain the use of SPDG-supported practices.
SPDG Annual Performance Report Program measure 1: Projects use evidence-based professional development practices to support the attainment of identified competencies. • High-Quality Professional Development Checklist
SPDG Annual Performance Report Program measure 1: Projects use evidence-based professional development practices to support the attainment of identified competencies. • Pre/post-tests
SPDG Annual Performance Report Program measure 1: Projects use evidence-based professional development practices to support the attainment of identified competencies. • Pre/post-tests
SPDG Annual Performance Report Program measure 1: Projects use evidence-based professional development practices to support the attainment of identified competencies. • Satisfaction surveys
SPDG Annual Performance Report Program measure 1: Projects use evidence-based professional development practices to support the attainment of identified competencies. • Collaboration Survey
SPDG Annual Performance Report Program measure 1: Projects use evidence-based professional development practices to support the attainment of identified competencies. • Collaboration Survey
SPDG Annual Performance Report Program measure 1: Projects use evidence-based professional development practices to support the attainment of identified competencies. • Collaboration Survey
SPDG Annual Performance Report Program measure 2: Participants in SPDG professional development demonstrate improvement in implementation of SPDG-supported practices over time. • School Implementation Scale • Team Functioning Survey • Student data • Attendance • State assessment proficiency rates • Inclusion data • Discipline data • Response rate data
SPDG Annual Performance Report Program measure 2: Participants in SPDG professional development demonstrate improvement in implementation of SPDG-supported practices over time. • Student data
SPDG Annual Performance Report Program measure 2: Participants in SPDG professional development demonstrate improvement in implementation of SPDG-supported practices over time. • Response rate data
SPDG Evidence-Based Professional Development Components Rubric • Management team rates the project’s performance annually • Results are reported to OSEP in the APR • Domains: • Selection • Training • Coaching • Performance Assessment • Facilitative Administrative Support/Systems Intervention
SPDG Evidence-Based Professional Development Components Rubric
Review Collaboration Survey results • What results did you expect to see? Does the data match your expectations? How does it differ? • Which entities does your RPDC do a good job of collaborating with? • Which entities could your RPDC do a better job of collaborating with? • What are some of the barriers you encounter when collaborating with these entities? How could those barriers be overcome? Blog post: List two entities you would like to improve collaboration with and explain how you plan to accomplish this.
Review Quarterly Reports (pre/post-test results & satisfaction survey results) • What results did you expect to see? Does the data match your expectations? How does it differ? • What do the pre/post-test results tell you about what content areas need to be re-taught? • What do the pre/post-test results tell you about how consistently the pre- and post-tests are administered? How could you improve distribution of these tests? • What do the satisfaction survey results tell you about the efficacy of content delivery? How could content delivery be improved? Blog post: Describe your plan for improving administration of pre/post-tests.
Research Collaboration Jennifer Brussow jbrussow@ku.edu Pattie Noonan pnoonan@ku.edu (785) 864-0517
Blog post: Based on your results from the School Implementation Scale, list three action items you might suggest to schools in your region. Blog about your data findings Blog post: Based on your results from the Team Functioning Survey, list three steps you can take to help building-level teams improve their team functioning. Blog post: Based on your results from the Collaboration Survey, list two entities you would like to improve collaboration with and explain how you plan to accomplish this. Blog post: Based on your results from the quarterly reports, describe your plan for improving administration of pre/post-tests.