Download
1 / 1
10 likes | 211 Views
Fig. 1. Bathymetry and sampling locations in the northern SCS and Luzon Strait for Ra measurements. China. Taiwan. China. Taiwan. South China Sea. South China Sea. Luzon. Luzon.

E N D
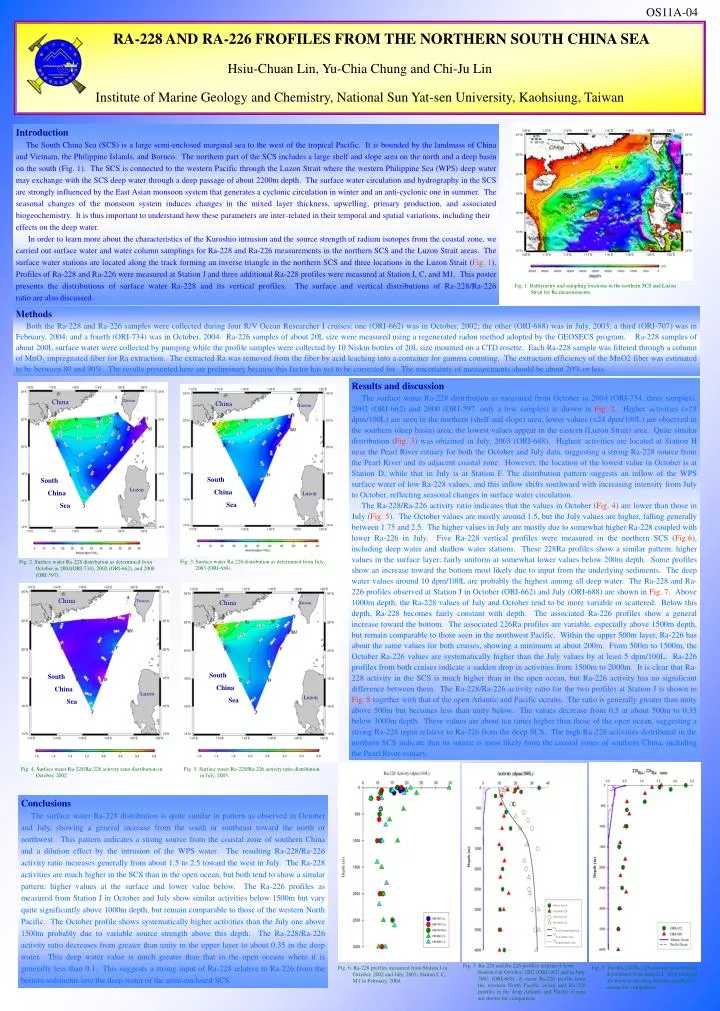
Fig. 1. Bathymetry and sampling locations in the northern SCS and Luzon Strait for Ra measurements. China Taiwan China Taiwan South China Sea South China Sea Luzon Luzon Fig. 3. Surface water Ra-228 distribution as determined from July, 2003 (ORI-688). Fig. 2. Surface water Ra-228 distribution as determined from October in 2004(ORI-734), 2002 (ORI-662), and 2000 (ORI-597). China Taiwan China Taiwan South China Sea South China Sea Luzon Luzon Fig. 5. Surface water Ra-228/Ra-226 activity ratio distribution in July, 2003. Fig. 4. Surface water Ra-228/Ra-226 activity ratio distribution in October, 2002. Fig. 7. Ra-228 and Ra-226 profiles measured from Station J in October, 2002 (ORI-662) and in July, 2003 (ORI-688). A mean Ra-226 profile from the western North Pacific ocean and Ra-228 profiles in the deep Atlantic and Pacific oceans are shown for comparison. Fig. 8. The Ra-228/Ra-226 activity ratio profiles determined from Station J. Also included are those in the deep Atlantic and Pacific oceans for comparison. Fig. 6. Ra-228 profiles measured from Station J in October, 2002 and July, 2003; Station I, C, M1 in February, 2004. OS11A-04 RA-228 AND RA-226 FROFILES FROM THE NORTHERN SOUTH CHINA SEA Hsiu-Chuan Lin, Yu-Chia Chung and Chi-Ju Lin Institute of Marine Geology and Chemistry, National Sun Yat-sen University, Kaohsiung, Taiwan Introduction The South China Sea (SCS) is a large semi-enclosed marginal sea to the west of the tropical Pacific. It is bounded by the landmass of China and Vietnam, the Philippine Islands, and Borneo. The northern part of the SCS includes a large shelf and slope area on the north and a deep basin on the south (Fig. 1). The SCS is connected to the western Pacific through the Luzon Strait where the western Philippine Sea (WPS) deep water may exchange with the SCS deep water through a deep passage of about 2200m depth. The surface water circulation and hydrography in the SCS are strongly influenced by the East Asian monsoon system that generates a cyclonic circulation in winter and an anti-cyclonic one in summer. The seasonal changes of the monsoon system induces changes in the mixed layer thickness, upwelling, primary production, and associated biogeochemistry. It is thus important to understand how these parameters are inter-related in their temporal and spatial variations, including their effects on the deep water. In order to learn more about the characteristics of the Kuroshio intrusion and the source strength of radium isotopes from the coastal zone, we carried out surface water and water column samplings for Ra-228 and Ra-226 measurements in the northern SCS and the Luzon Strait areas. The surface water stations are located along the track forming an inverse triangle in the northern SCS and three locations in the Luzon Strait (Fig. 1). Profiles of Ra-228 and Ra-226 were measured at Station J and three additional Ra-228 profiles were measured at Station I, C, and M1. This poster presents the distributions of surface water Ra-228 and its vertical profiles. The surface and vertical distributions of Ra-228/Ra-226 ratio are also discussed. Methods Both the Ra-228 and Ra-226 samples were collected during four R/V Ocean Researcher I cruises: one (ORI-662) was in October, 2002; the other (ORI-688) was in July, 2003; a third (ORI-707) was in February, 2004; and a fourth (ORI-734) was in October, 2004. Ra-226 samples of about 20L size were measured using a regenerated radon method adopted by the GEOSECS program. Ra-228 samples of about 200L surface water were collected by pumping while the profile samples were collected by 10 Niskin bottles of 20L size mounted on a CTD rosette. Each Ra-228 sample was filtered through a column of MnO2 impregnated fiber for Ra extraction. The extracted Ra was removed from the fiber by acid leaching into a container for gamma counting. The extraction efficiency of the MnO2 fiber was estimated to be between 80 and 90%. The results presented here are preliminary because this factor has yet to be corrected for. The uncertainty of measurements should be about 20% or less. Results and discussion The surface water Ra-228 distribution as measured from October in 2004 (ORI-734, three samples), 2002 (ORI-662) and 2000 (ORI-597, only a few samples) is shown in Fig. 2. Higher activities (>28 dpm/100L) are seen in the northern (shelf and slope) area; lower values (<24 dpm/100L) are observed in the southern (deep basin) area; the lowest values appear in the eastern (Luzon Strait) area. Quite similar distribution (Fig. 3) was obtained in July, 2003 (ORI-688). Highest activities are located at Station H near the Pearl River estuary for both the October and July data, suggesting a strong Ra-228 source from the Pearl River and its adjacent coastal zone. However, the location of the lowest value in October is at Station D, while that in July is at Station F. The distribution pattern suggests an inflow of the WPS surface water of low Ra-228 values, and this inflow shifts southward with increasing intensity from July to October, reflecting seasonal changes in surface water circulation. The Ra-228/Ra-226 activity ratio indicates that the values in October (Fig. 4) are lower than those in July (Fig. 5). The October values are mostly around 1.5, but the July values are higher, falling generally between 1.75 and 2.5. The higher values in July are mostly due to somewhat higher Ra-228 coupled with lower Ra-226 in July. Five Ra-228 vertical profiles were measured in the northern SCS (Fig.6), including deep water and shallow water stations. These 228Ra profiles show a similar pattern: higher values in the surface layer; fairly uniform at somewhat lower values below 200m depth. Some profiles show an increase toward the bottom most likely due to input from the underlying sediments. The deep water values around 10 dpm/100L are probably the highest among all deep water. The Ra-228 and Ra-226 profiles observed at Station J in October (ORI-662) and July (ORI-688) are shown in Fig. 7. Above 1000m depth, the Ra-228 values of July and October tend to be more variable or scattered. Below this depth, Ra-228 becomes fairly constant with depth. The associated Ra-226 profiles show a general increase toward the bottom. The associated 226Ra profiles are variable, especially above 1500m depth, but remain comparable to those seen in the northwest Pacific. Within the upper 500m layer, Ra-226 has about the same values for both cruises, showing a minimum at about 200m. From 500m to 1500m, the October Ra-226 values are systematically higher than the July values by at least 5 dpm/100L. Ra-226 profiles from both cruises indicate a sudden drop in activities from 1500m to 2000m. It is clear that Ra-228 activity in the SCS is much higher than in the open ocean, but Ra-226 activity has no significant difference between them. The Ra-228/Ra-226 activity ratio for the two profiles at Station J is shown in Fig. 8 together with that of the open Atlantic and Pacific oceans. The ratio is generally greater than unity above 500m but becomes less than unity below. The values decrease from 0.5 at about 500m to 0.35 below 3000m depth. These values are about ten times higher than those of the open ocean, suggesting a strong Ra-228 input relative to Ra-226 from the deep SCS. The high Ra-228 activities distributed in the northern SCS indicate that its source is most likely from the coastal zones of southern China, including the Pearl River estuary. Conclusions The surface water Ra-228 distribution is quite similar in pattern as observed in October and July, showing a general increase from the south or southeast toward the north or northwest. This pattern indicates a strong source from the coastal zone of southern China and a dilution effect by the intrusion of the WPS water. The resulting Ra-228/Ra-226 activity ratio increases generally from about 1.5 to 2.5 toward the west in July. The Ra-228 activities are much higher in the SCS than in the open ocean, but both tend to show a similar pattern: higher values at the surface and lower value below. The Ra-226 profiles as measured from Station J in October and July show similar activities below 1500m but vary quite significantly above 1000m depth, but remain comparable to those of the western North Pacific. The October profile shows systematically higher activities than the July one above 1500m probably due to variable source strength above this depth. The Ra-228/Ra-226 activity ratio decreases from greater than unity in the upper layer to about 0.35 in the deep water. This deep water value is much greater than that in the open oceans where it is generally less than 0.1. This suggests a strong input of Ra-228 relative to Ra-226 from the bottom sediments into the deep water of the semi-enclosed SCS.