Download
1 / 23
230 likes | 231 Views
This study evaluates the temperature dependence on foraminiferal Mg/Ca and B/Ca ratios in surface-dwelling species using sediment trap data. It also reconstructs paleo-environmental changes in the South China Sea. The study concludes with remarks on atmospheric CO2 and global warming.

E N D
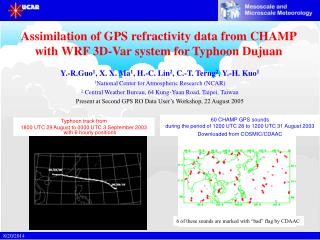
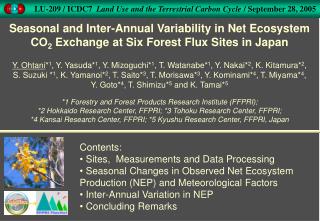
International Sediment Trap Workshop A Further Evaluation of Temperature Dependence on Foraminiferal Mg/Ca and B/Ca in Surface-dwelling Species, Globigerinoides ruber: A sediment trap study Kuo-Fang Huang1, C.-F. You1, Y. Rosenthal2, H.-L. Lin3, and Y.-T. Shieh4 1Earth Dynamic System Research Center (EDSRC), NCKU, Tainan, Taiwan Also at Department of Earth Sciences, NCKU, Tainan, Taiwan 2Institute of Marine and Coastal Sciences, Rutgers University, NJ, United States 3Institute of Marine Geology and Chemistry, NSYSU, Kaohsiung, Taiwan 4National Taiwan Museum, Taipei, Taiwan March 23, 2009
Outline 1. Introduction of Foraminiferal Shell Chemistry as Environmental Proxies 2. Materials and Analytical Method 3. Potential Controlling Factors on Foraminiferal Mg/Ca and B/Ca --- Biological control --- Partial dissolution --- Temperature effect 4. Reconstructions of the Paleo-environmental Change in the South China Sea --- Sea Surface Temperature (SST) record over the past 21 kyr --- Oceanic pH record over the past 21 kyr --- Aqueous pCO2 record over the past 21 kyr 5. Concluding Remarks
Atmospheric CO2 vs.Global warming Keeling Curve Natural or anthropogenic feedback?
Understand the linkage between EAM and climate change a. Modern Climate database • b. Long-term paleo-climate variations (geochemical proxies and proxy carrier) • Understand the linkage between atmospheric CO2 and climate change a. Modern Climate Dynamics • b. Long-term Paleo-climate Variations (geochemical proxies and proxy carrier) We need to focus on: 1. Effect of the monsoon on pastSea Surface Temperature(SST) ---Mg/Ca-SSTrecord [Rosenthal et al., 1997; 2000; Lea et al., 1999] 2. Reconstruction ofSea Surface Salinity(SSS), associated with precipitation --- Paired Mg/Ca-SST and 18O(T, S, and IV)[Lea et al., 2000; Rosenthal et al., 2003] 3. Reconstruction ofseawater pCO2 or oceanic pH --- Foraminiferal11Brecord [Spivack, A. J., You, C.-F., Smoth, J., 1994; Palmer and Pearson, 2003; Hönisch and Hemming, 2005] --- ForaminiferalB/Ca and U/Carecord[Yu et al., 2007; Russell et al., 2004] Here we focus on the two most important environmental parameters: 1. ReconstructionofSea Surface Temperature(SST) ---Mg/Ca-SSTrecord [Rosenthal et al., 1997; 2000; Lea et al., 1999] 2. Reconstructions ofoceanic pHorseawater pCO2 --- Foraminiferal11Brecord [Spivack, A. J., You, C.-F., Smoth, J., 1994; Hönisch and Hemming, 2005] --- ForaminiferalB/CaandU/Carecord [Russell et al., 2004;Yu et al., 2007] 3. Reconstruction ofSea Surface Salinity(SSS), associated with precipitation --- Paired Mg/Ca-SST and 18O (T, S, and IV)[Lea et al., 2000; Rosenthal et al., 2003] 1. Calibrations of shell chemistry in planktonic foraminifera 2. Applying to the down-core record 1. Calibrations of Shell chemistry in planktonic foraminifera 2. Applying to down-core sediments (accurate records)
How to calibrate trace elements or isotopes in foraminifera ? 1. Cultivation experiment:[Delaney et al., 1985; Lea et al., 1999] excellent for evaluate “SINGLE” environmental parameters (1) controlled environment may not reproduce in nature; (2) a very limited species can be incubated in the Lab 2. Core-top sediment:[Elderfield and Ganssen, 2000] reflect the materials that are buried to form the proxy carrier (1) potential artifacts--- dissolution effect (e.g., shell Mg/Ca); (2) difficulties in establishing the link with single parameters 3. Sediment trap and plankton tow:[Anand et al., 2003; Huang et al., 2008] can be used tobridge the gap between controlled culture experiments and field core-top calibrations. (Kimoto et al., 2003) (NCOR)
Ca2+ + HCO3- CaCO3 + H+ Life cycle of planktonic foraminifera G. ruber G. sacculifer 0m 0m 20m biweekly Monthly 50m N. dutertrei 50m Seawater CaCO3 Mg2+ Sr2+ 100m Monthly Ba2+ Li+ G. inflata 200m B(OH)4- mainly controlled by seawater chemical or physical properties, especially T, based on “equilibrium thermodynamics” 1994-1999, NCOR Monthly 400m
using the in situ calibration of KD- T Measured value As a function of pH Principle of foraminiferal B/Ca as a proxy for seawater pH When pH increases --- > B(OH)4- *** B/Ca ratio in the forams increases (δ11B value increases) 11B(OH)3 10B(OH)4- (B/Ca)foram = f (Temperature and pH) (Yu et al., 2007) seawater (cf. Hemming and Hanson, 1992)
KK3 Sample Locality Sediment Trap Core-top sediment 276-19B ODP 1145
Three dominant planktonic species in the SCS G. ruber (white) G. sacculifer N. dutertrei G. ruber G. sacculifer N. dutertrei Materials and Methods [1] Oxygen and carbon isotopic compositions were taken from Lin et al. (2004). --- Species-specific mean habitat depth[Huang et al., 2008] δ18OC= (δ18Osw-0.27)+[4.38-(4.382-4*0.1*(16.9-T)0.5]/2*0.1 --- Eq. (1) [Shackleton, 1974] δ18Osw= -11.6 + 0.33*S --- Eq. (2) [Lin et al., 2003] [2] Cleaning method: Cd-clean method[Boyle and Keigwin, 1985 and modified by Prof. Rosenthal] Methanol (fine clay) 50% H2O2 buffered in 0.1M NaOH (organic matter) DTPA (barite and Fe-Mn oxides)--- due to large amounts of detrital materials [3] Trace element ratios were measured by HR-ICP-MS (Element 2) --- Fe, Al, Mn to monitor detrital contaminants (fine clay, Fe-Mn oxides)
Stable Sample Introduction Scott-type spray chamber HR-ICP-MS—Element 2 Analytical method at EDSRC Analytical Technique Cleaning procedure
High-precision determinations of trace elements by HR-ICP-MS *** Inter-laboratory calibration (Rutgers University and Woods Hole Oceanographic Institution)
Results and Discussion *** Potential Controlling Factors on Foraminiferal Mg/Ca and B/Ca --- Biological control --- species variability and size fraction --- Partial dissolution --- Temperature dependency --- in situ calibration of Mg/Ca and B/Ca in foraminifera
212- 250 250- 300 300- 355 355- 425 425- 500 Biological effect on Mg/Ca_ species variability and size fraction Mg/Ca 1. Mg/Ca ratio: G. ruber (white) > G. sacculifer > N. dutertrei --- can be related to the higher SST at the surface ocean living depth: G. ruber (white) < G. sacculifer < N. dutertrei --- consistent with mean habitat depths estimated from δ18O data 2. The Mg/Ca ratio in G. ruber increases with increasing size --- possibly caused by calcification rate, Elderfield et al., 2002) Water depth: 329 m Mg/Ca (mmol/mol) Mg/Ca Water depth: 727m Size fraction (µm)
212- 250 250- 300 300- 355 355- 425 425- 500 Biological effect on B/Ca_ species variability and size fraction B/Ca 1. B/Ca ratio: G. ruber (white) > G. sacculifer > N. dutertrei --- can be attributed to the higher SST and pH at the surface ocean 2. The B/Ca ratio in G. ruber (white) shows a size dependency, --- characterized by an increase in B/Ca with increasing size --- possibly affected by calcification rate (kinetic effect !!!) Water depth: 329 m B/Ca (µmol/mol) B/Ca Reliable data: single species + narrow size range Water depth: 1957m Size fraction (µm)
Effect of partial dissolution Size range: 250-300 μm Ave. shell weight and Mg/Ca decrease with increasing depth, which can be attributed to the strong partial dissolution in the SCS[Brown and Elderfield, 1997; Huang et al., 2008] Partial dissolution can significantly alter the foraminiferal Mg/Ca, but not affect shell B/Ca ratios !!! Need a dissolution-corrected Mg/Ca-SST equation
Temperature dependency on foraminiferal Mg/Ca Data were taken from the sediment traps deployed at several depths: [Huang et al., 2008] Size fraction: 250-300 μm In situ calibration equation
In situ calibration of B/Ca and seawater temperature G. ruber (white) 250-300 μm G. ruber (SCS) KD (X 1000) B/Ca (µmol/mol) G. ruber (N. Atlantic) ODP 688 and T86&88 are taken from Yu et al., 2007 Mg/Ca-based Seawater Temperature (˚C) Seawater Temperature (˚C) Strong temperature-dependency !!! G. ruber(250-300µm), KD= 0.233 exp (0.080*SST), r2=0.76 G. sacculifer(300-355µm), KD= 0.228 exp (0.071*SST), r2=0.87 N. dutertrei(300-355µm), KD= 0.290 exp (0.065*SST), r2=0.78
Reconstruction of paleo-SST variation over the Last 21 kyr Species: G. ruber (white, s.s.) Size range: 250-300 μm Holocene-LGM transition Holocene-Last Glacial Maximum (LGM): I. SST at the LGM was 4.5˚C lower than the Holocene II. A tight relationship between SST and δ18O data from Greenland ice core and Chinese speleothem indicates a strong connection between N. Atlantic and East Asian Moon (EAM). YD B/A LGM NGRIP δ18O sw (‰) δ18O (‰,Hulu-Dongge) dry Modern SST Need the high-resolution record to evaluate the teleconnectionbetween NAO and EAM [Oppo et al., 2004; Oppo and Sun, 2005] Mg/Ca-SST (°C) Age (ka)
Reconstruction of change in seawater pH over the Last 21 kyr ALK= f (s) and constant ALK δ11B-based pH Preindustrial pH Calculated ΔpCO2= pCO2sw - pCO2atmo. The pH (pCO2) in the glacial surface waters was ~0.25 (±0.02) pHunitshigher (or 140 ±20 ppmv lower) than the Holocene Interglacial: the SCS serves as a source for CO2 Glacial: the SCS is a sink
Seawater pCO2 record over the past 21 kyr Vostok CO2 (ppmv) Seawater pCO2 (uatm) Age (ka) Vostok CO2 concentration --- Petit et al., 1999 [1] Seawater pCO2 > atmospheric pCO2: 6-8 ka (Mid-Holocene, ΔpCO2= +60 ppmv) and 12-15 ka (Bølling/Allerød, +40 ppmv) --- more La Nina-like condition at the warm period [Koutavas et al., 2002; Palmer and Pearson, 2003] [2] Atmospheric pCO2 > seawater pCO2: 18-21 ka (Last Glacial Maximum, ΔpCO2=-50 ppmv) --- can be related to the enhanced primary productivity during the glacial period [Higginsion et al., 2003] [3] Tropical oceanic pCO2 (also SST) change leads the atmospheric CO2 variation by ~2 kyr --- Tropical SST and CO2 trigger the global climate change ? (need high-resolution data !!!)
Concluding Remarks [1] Foraminiferal Mg/Ca and B/Ca ratios in the three dominant species collected from sediment traps and core-top sediments in the South China Sea show the strong “ temperature” dependency. However, the effect of biological activity on shell chemistry still needs to be further evaluated before applying to the reconstructions of SST and seawater pH. Partial dissolution can significantly alter the shell Mg/Ca but not for B/Ca ratios. --- Single species with narrow size range, and in situ calibration equation [2] The in situ calibrations of Mg/Ca-SST and KD(B/Ca)-SST equations for G. ruber (white , 250-300 µm) have been established using sediment-trap and core-top specimens, and can be further applied to the down-core sediments for the reconstructions of paleo-SST and pH records in the SCS. [3] The Mg/Ca of G. ruber (white, s.s., 250-300 µm) from ODP Site 1145 suggests that SST at the LGM was 4.5˚C lower than the Holocene, and shows an instability of seawater pH in the northern SCS over the last 21 kyr BP. The pH (orpCO2) in glacial surface waters was approximately 0.25 pH unit higher (or 140 ppmv lower) than the Holocene. This observation indicates that the SCS was a strong CO2 sink to the atmosphere during the LGM, and presumably reflects a significant increase in regional primary productivity in the northern SCS during the LGM.
Acknowledgments Dr. Delia Oppo (Woods Hole Oceanographic Institution, USA) Drs. Rob Sherrell and Sindia Sodian (IMCS, Rutger University, USA) Michelle, Eleni, Paul, Marina, Emily, and Kate (IMCS, Rutgers University, USA) Dr. W.-C. Chou (National Taiwan Ocean University, Taiwan) Ocean Drilling Program (ODP) Leg 184 Scientific Party Captains and crews of ORI and ORIII (Taiwan) National Center for Ocean Research ( , Taiwan) National Science Council (NSC, Taiwan)
THANK YOU FOR YOUR ATTENTION EDSRC-NCKU, Taiwan