Download
1 / 23
230 likes | 233 Views
This study investigates the performance and evaluation methods of hydrological forecasts, focusing on forecast uncertainty and its impact on user expectations. The study provides insights into deterministic and probabilistic forecast models, flash flood guidance, and evaluation techniques for forecasters and users. It emphasizes the importance of understanding forecast uncertainty and avoiding false expectations.

E N D
What forecast users might expect: an issue of forecast performance Tomas Vlasak, RadekCekal & Jan Danhelka Czech Hydrometeorological Institute Czech republic
Hydrological service in the Czech republic • Deterministic forecast (> 100 forecasting points 48hours / 1hour step) • Flash flood guidance FFG-CZ • Short-range probabilistic forecast (based on ensemble QPF) • Medium-range probabilistic forecast (based on historical analogs)
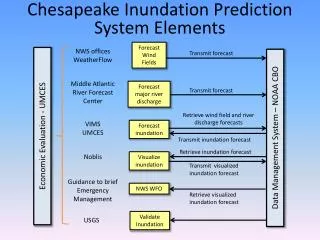
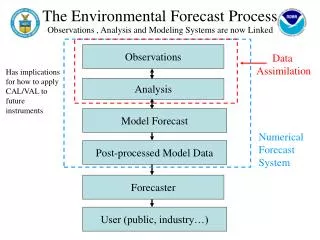
Hydrological forecast evaluation Feedback for FORECASTERS: model parameters or model structure data input human impact strategy Feedback for forecast USERS: realize forecast uncertainty estimate forecast uncertainty avoid false expectation
Evaluation methods Comprehensible not only for expert. Simplification to 1 indicator: • threshold exceeding - YES/NO • total flow volume • discharge maximum Evaluation of whole of forecasting process without prior differentiation of the source of uncertainty.
Evaluation methods – forecasts selection Target to flood forecasts Selection conditions: 1) forecasted or observed discharge exceeded flood threshold 2) last measured discharge was smaller then threshold
Categorical evaluation • portion of these category in different aspect: Threshold Basin area Season Year Forecasting office • categorical statistics Hit Rate False Alarm Ratio Frequency Bias Critical Success Index ..... HIT HIT HIT MISS FALSE ALARM FALSE ALARM
Categorical evaluation – RESULTS – different thresholds • Decrease of portion of HITS with increasing of flood extremity is small • MISS forecasts prevail to FALSE ALARM low FLOOD EXTREMITY high
Categorical evaluation – RESULTS – basin area • Forecasts for big rivers are more successful • uncertainty of QPF produce FALSE ALARMS and uncertainty of hydrological modeling MISSES
Categorical evaluation – RESULTS – lead time • Decrease of HIT rate is significant to first 24 hours of lead time. The most of forecasting points delimit basins with lag time shorter then 24h
Categorical evaluation – RESULTS – lead time • Decrease of HIT rate is significant to first 24 hours of lead time. The most of forecasting points delimit basins with lag time shorter then 24h
Categorical evaluation – RESULTS – lead time • Decrease of HIT rate is significant to first 24 hours of lead time. The most of forecasting points delimit basins with lag time shorter then 24h
Categorical evaluation – RESULTS - years • Without significant trend
Categorical evaluation – RESULTS – years –regional office Plzeň • change of hydrological model performance after model recalibration in 2010
Categorical evaluation - RESULTS • Forecasting point on big river has more successful forecasts
Categorical evaluation - RESULTS • Influence of different forecaster‘s strategy Predominance of MISS category Predominance of FALSE ALARM category
http://1url.cz/4Jc0 THANK YOU