Download
1 / 30
300 likes | 478 Views
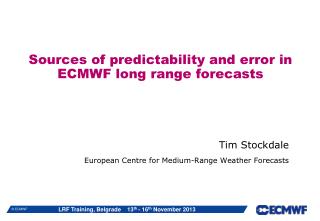
Verification of ECMWF long range forecast systems. Tim Stockdale Laura Ferranti European Centre for Medium-Range Weather Forecasts. Outline:. 1. Factors limiting model performance Bias Errors in variability Simple calibration 2. Measuring seasonal forecast skill

E N D
Verification ofECMWF long range forecast systems Tim Stockdale Laura Ferranti European Centre for Medium-Range Weather Forecasts
Outline: • 1. Factors limiting model performance • Bias • Errors in variability • Simple calibration • 2. Measuring seasonal forecast skill • 3. Important issues affecting skill assessment • 4. EUROSIP calibrated products
SST Biases for DJF Biases from 4 independent coupled systems included in the EUROSIP multi-model (1996-2009) a b c d
Assessing spatial errors :leading modes of rainfall variability Observed System 3 r=0.33 System 4 r=0.71 EOF 1 r=0.0 r=0.44 EOF 2
Bias correction • Model drift is typically comparable to signal • Both SST and atmosphere fields • Forecasts are made relative to past model integrations • Model climate estimated from 30 years of forecasts (1981-2010), all of which use a 15 member ensemble. Thus the climate has 450 members. • Model climate has both a mean and a distribution, allowing us to estimate e.g. tercile boundaries. • Model climate is a function of start date and forecast lead time. • EXCEPTION: Nino SST indices are bias corrected to absolute values, and anomalies are displayed w.r.t. a 1971-2000 climate. • Implicit assumption of linearity • We implicitly assume that a shift in the model forecast relative to the model climate corresponds to the expected shift in a true forecast relative to the true climate, despite differences between model and true climate. • Most of the time, assumption seems to work pretty well. But not always.
SST bias is a function of lead time and season. Some systems have less bias, but it is still large enough to require correcting for.
Nino plumes: variance scaling • Model Nino SST anomalies in S4 have too large amplitude • Problem is especially acute in boreal spring and early summer (model bias of “permanent La Nina” does not allow spring relaxation physics to apply; this was something S3 did very well) • We plot the “Nino plumes” corrected for both mean and variance, instead of just the mean. • This is done by scaling the model anomalies so that the model variance matches the observed variance in the calibration period • We use the same approach (cross-validated) when calculating scores • This affects the plotting, not the model data itself • The spatial maps are not affected: the tercile and quintile probability maps are already implicitly standardized wrt model variance • General technique: is also used in our multi-model system
Variance adjusted Unadjusted model anomalies
2. Measuring seasonal forecast skill • A set of verification scores for deterministic and probabilistic forecast should be used. • There is no single metric that can fully represent the quality of the probabilistic forecasts. • The robustness of verification statistics is always a function of the sample size. WMO –SVSLRF suggests 20 years. • Typically verification is performed in cross-validation mode. • The skill depends strongly on the season, so forecasts evaluated separately for different starting months.
2m temp grid-point anomaly correlation Sys 4 JJA month 2-4 Sys 3
Reliability diagrams JJA 2m temp upper tercile Tropical band Europe
3. Important issues for skill assessment • The limitation associated with the sample size • The effect of long term trend • The effect of the ensemble size
ECMWF Annual Seminar 2009, 9 September 2009 The limitation associated with the sample size Variations in the spread of estimates of AC (y-axis) with the expected values of AC(x axis). The differences in the AC estimates are due to the limited length of the verification time series. Spread is shown for verification size 10-50. Kumar 2009 For an “accurate” estimate of deterministic skill over the tropics 20 years sample might be sufficient while over mid-latitudes a larger sample (>40 years) is needed.
Sensitivity to the re-forecast period over Europe (but see later!) JJA - Reliability for 2m temp anomaly in the upper tercile 1981-2010 1996-2010
Seasonal forecast skill assessment: • The limitation associated with the sample size • The effect of long term trend • The effect of the ensemble size
The effect of long term trend in the sample • The surface air temperature during the last 30 years exhibits a warming trend. • This global warmth in the last decades is a continuation of the upward warming trend observed since the mid-20 century in response to the increase of GHGs. • Correct GHGs are important for seasonal forecast systems (Doblas-Reyes at al. 2006, Linigeret al. 2007, Cai et al. 2009) • In the skill assessment can we distinguish the ability of reproducing the effect of climate change from the ability of predicting the year-to-year variations of anomalies?
Verification with a moving climate to filter out the effects of long term trends: Anomalies with respect to a fixed climate (1981-2005) Anomalies with respect to a moving climate (1960-1979, 1961-1980, ……..1988-2007)
ACC=0.68 ACC=0.35
LONG TERM TRENDS surface temp Eurosip m2 analysis ECMWF
Seasonal forecast skill assessment: • The limitation associated with the sample size • The effect of long term trend • The effect of ensemble size
Compensating forensemble size? • Müller et al. 2005 and Weigel et al. 2007 suggested the use of a de-biased Brier and ranked probability skill score to avoid the dependency on the ensemble size. • The BSSd and RPSSd are effective tools: to evaluate Prob. Forecasts with small ensemble size • to compare different Prob. Syst. of different ensemble size. BUT these techniques correct for (expected) bias only, do not account for random error in score From Weigel et al. 2007
S4 extended hindcast set Scores are smoother and systematically higher with 51 member hindcasts
S4 extended hindcast set Gain over S3 is now stronger and more robust
4. EUROSIP calibrated products • A European multi-model seasonal forecast system • Operational since 2005 • Data archive and real-time forecast products • Initial partners: ECMWF, Met Office, Météo-France • NCEP an Associate Partner; forecasts included since 2012 • Products released at 12Z on the 15th of each month • Aim is a high quality operational system • Data policy issues are always a factor in Europe
Calibrated p.d.f. • ENSO forecasts have good past performance data • We can calibrate forecast spread based on past performance • We can also allow varying weights for models • We have to be very careful not to overfit data at any point. • Represent forecast with a p.d.f. • This is the natural output of our calibration procedure • Easier visual interpretation by user • Calibration and combination in general case • Ideally apply similar techniques to all forecast values (T2m maps etc) • More difficult because less information on past (higher noise levels) • Hope to get there eventually ….. .
P.d.f. interpretation • P.d.f. based on past errors • The risk of a real-time forecast having a new category of error is not accounted for. E.g. Tambora volcanic eruption. • We plot 2% and 98%ile. Would not go beyond this in tails. • Risk of change in bias in real-time forecast relative to re-forecast. • Bayesian p.d.f. • Explicitly models uncertainty coming from errors in forecasting system • Two different systems will calculate different pdf’s – both are correct • Validation • Rank histograms show pdf’s are remarkably accurate (cross-validated) • Verifying different periods shows relative bias of different periods can distort pdf – sampling issue in our validation data.