Download
1 / 58
580 likes | 583 Views
Pigments and aquatic animals research. Analysis of carotenoids. STRUCTURE AND PROPERTIES. Solubility Conjugated double bond system: - colour - reactivity - shape - isomerisation. Carotenoids:- long conjugated double-bond chromophore

E N D
Pigments and aquatic animals research Analysis of carotenoids
STRUCTURE AND PROPERTIES • Solubility • Conjugated double bond system: - colour - reactivity - shape - isomerisation
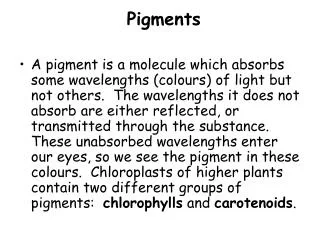
Carotenoids:- • long conjugated double-bond chromophore • absorb light in the visible region (400-500 nm) • yellow-orange colours
Reactivity Conjugated double-bond system – electron rich Reactive towards electrophiles, especially oxidizing agents Antioxidant/pro-oxidant properties Easily oxidized – unstable
Colour in vivo Many factors can affect the colour of carotenoids in situ: Structure (chromophore) Concentration Aggregation or crystallisation Molecular environment or medium Interaction with other molecules
Solubility Insoluble in water Soluble in organic solvents Form aggregates in polar medium Easily crystallise
Unstable, especially in presence of oxygen - determines general handling Solubility - determines extraction and separation Light absorption - determines detection, identification, quantitative analysis
Scale of early work • Target: 1-10 g crystalline carotenoid • Needed for chemical degradation etc • Most extractions used about 100 kg or more of natural material and 100s of litres of solvent
Scale of early isolations • Carrots. 100 kg gave 3 g carotin • Leaves: 100kg dried nettles gave 3 g carotin and 12 g xanthophyll • Tomatoes: 135 kg gave 2.7 g lycopin • Eggs: 6,000 egg yolks gave 4 g crude xanthophyll.
Chemistry research today • Scale – about 1 mg • Enough for very complex structures • Chromatography, especially HPLC, routine • Sophisticated spectroscopic methods and equipment
Extraction - use organic solvent - the solvent should mix with water so that it penetrates the tissue - acetone, tetrahydrofuran, ethanol best - water-immiscible solvents e.g. ether cannot penetrate the water barrier and enter the tissue
The first extraction may mainly remove water, so that the second extraction is more efficient Repeat the extraction until no more colour is released Also extracts other lipids, e.g. oil and fat, and chlorophylls Chloroform/methanol, often used to extract lipids, works well but chloroform can cause degradation
Can extract dried materials by grinding or soaking in solvent, including immiscible solvents Extraction of dried material may be more efficient if the material is moistened with water and extracted with acetone For large-scale extraction of tissues, use a mechanical blender For small-scale extraction use a mortar and pestle
Extraction of microbial cells is often more efficient with hot solvent Start with cold solvent, then rapidly bring this to boiling point The colour usually comes out quickly then Short exposure to heat is less damaging than extracting with cold solvent for a long time
Partition/transfer Add ether/petroleum spirit mixture to the extract and mix, then add water and swirl Carotenoids go into the upper organic layer Miscible solvent and water-soluble substances go into the lower, water, layer Add solvent first, then water Add salt to break emulsions, give clear solution
Evaporation Large volume – use rotary evaporator to evaporate at low temperature under vacuum. Then dissolve in a small volume to transfer. Small volume or final drying in a small tube or vial. Warm gently and blow a gentle stream of nitrogen to evaporate. Store sealed under nitrogen. In freezer.
Saponification Alkaline hydrolysis with KOH Used to break down oils and fats Makes extract easier to work with Also destroys chlorophylls Try small scale, check for changes in pigment composition Don’t use if astaxanthin may be present Don’t use if interested in carotenoid esters
Safety Solvents - may be low boiling point and flash point - risk of fire and explosion Some solvents are toxic or carcinogenic - avoid contact with skin - do not breathe the vapour Benzene, hexane, acetonitrile are most dangerous
Safety Equipment - Never use broken, chipped or cracked glassware - When applying a vacuum, e.g. with a rotary evaporator, use round-bottom flask, never a flat-bottom one - Always check round-bottom flasks for star cracks; if present, don’t use.
CONJUGATED DOUBLE-BOND SYSTEM • Visible light absorption – colour • Different conjugated double bond system length: - different chromophore, absorption maxima, colour • Yellow – orange – red in solution • Colour modified in situ, e.g. by protein – lobster blue
SOLUBILITY & AGGREGATION • Insoluble in water • In hydrophobic environment - fat, membrane • Readily form aggregates, especially in aqueous medium • Properties of monomers and aggregates different
ANALYSIS OF CAROTENOIDS • Chromatography: CC, TLC, HPLC • UV/Vis spectroscopy • MS, NMR, CD • HPLC – photodiode array detector • HPLC – MS • Quantitative analysis; UV/Vis absorbance
Carotenoids:- • long conjugated double-bond chromophore • absorb light in the visible region (400-500 nm) • yellow-orange colours
Separation and purification Chromatography - column chromatography - thin-layer chromatography (TLC) - high-performance liquid chromatography (HPLC) Same principles of separation
Principles of chromatography Separation based on distribution between stationary and mobile phases Adsorption – affinity for surface of stationary phase Partition – distribution between mobile phase (solvent) and water associated with the mobile phase
Normal phase. Polar compounds bind more strongly to the stationary phase (silica) Compounds of low polarity have higher affinity for the mobile phase. Polar compounds are more strongly bound. Elution order: apolar before polar. Reversed phase. Compounds of low polarity have higher affinity for the stationary phase. Elution order: polar before apolar.
Chromatography • 1950s: Thin-layer chromatography (TLC) • 1971: Stewart and Wheaton ‘Continuous- flow separation’ • 1970s/1980s: First HPLC equipment • ~1980: Reversed-phase columns (C18) • 1980s: Photodiode-array detectors
Column chromatography Stationary phase (adsorbent, usually alumina) packed into a glass column. Sample in apolar solvent applied to top Solvents of increasing polarity passed through Compounds eluted in order of increasing polarity and fractions collected
TLC on silica Silica coated onto a glass plate or sheet of aluminium foil or plastic Used for rapid preliminary screening on a small scale with a series of solvents of increasing polarity Used on preparative scale to purify
Elution from TLC Scrape off the desired band Add a stronger solvent Centrifuge – or Filter through a funnel with a cotton-wool plug Don’t use filter paper – colour will run up to the rim of the paper
Light absorption spectrum Carotenoids absorb light in the region 400-500nm The absorption wavelength and shape of the spectrum (fine structure) depend on the structure and give structural information First criterion for identification
Quantitative analysis Measure absorbance A. Absorbance is proportional to concentration Tables available of values for A1% (absorbance of 1 g in 100 ml) and of εmol (absorbance of a 1M solution) For a mixture or an unknown use A1% 2500 as a good approximation A1% 2500 means that A of 0.25 gives 1μg/ml
HPLC Method of choice: precise and accurate Requires only a very small sample Gives much information Gives a composition profile: components identified by retention time, spectrum.
HPLC – similar principles Stationary phase packed into a column Very small uniform particles, so high pressure needed to pump mobile phase through. Steel column used to withstand high pressure This determines the equipment
HPLC: Equipment Gradient programmer and mixer so that composition of mobile phase can be changed during run Pump(s) to deliver smooth controlled flow of mobile phase through column Column containing stationary phase UV/Vis or other detector with flow cell
UV/Visible light detector Eluate from column passes continuously through the flow cell Light of selected wavelegth is passed through the flow cell Absorbance is monitored Result plotted as absorbance A vs time Gives a chromatogram at a fixed wavelength Quantitative: peak areas proportional to concentration
Photodiode array detector Full spectrum white light is used as incident After passage through the flow cell the transmitted light is separated into the spectrum The transmitted spectrum fall onto an array of photodiodes, each set to receive light of a narrow wavelength range, e.g. 2 nm Photodiode response gives the absorbance at that wavelength
Information from PDA detector Photodiode array records absorbance at every wavelength across the spectral range Can get a chromatogram at any selected wavelength – for quantitative analysis Can get absorption spectrum at any point in the chromatogram, i.e. spectrum for every component
Information from PDA Simultaneously monitors three parameters: absorbance, time and wavelength Plot A vs time at fixed wavelength: gives standard chromatogram. Used for quantitative analysis, concentration proportional to peak area Plot A vs wavelength at a fixed time gives the absorption spectrum. Used with retention time for identification.