Download
1 / 34
340 likes | 354 Views
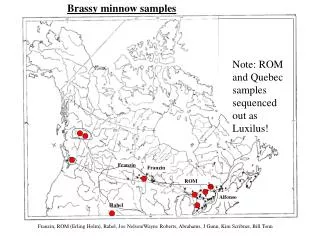
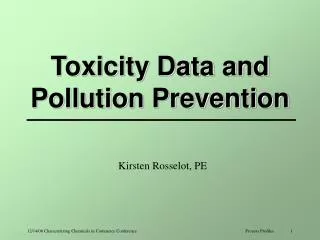
Development of the Fathead Minnow Narcosis Toxicity Data Base. Larry Brooke 1 , Gilman Veith 2 , Daniel Call 3 , Dianne Geiger 1 , and Christine Russom 4 1 University of Wisconsin-Superior, 2 QSAR foundation, 3 University of Dubuque, and 4 U.S. EPA Mid-Continent Ecology Laboratory.

E N D
Development of the Fathead Minnow Narcosis Toxicity Data Base Larry Brooke1, Gilman Veith2, Daniel Call3, Dianne Geiger1, and Christine Russom4 1University of Wisconsin-Superior, 2QSAR foundation, 3University of Dubuque, and 4U.S. EPA Mid-Continent Ecology Laboratory
Applying Predictive Data Mining to Predictive ToxicologyFrom Narcosis to McKim Conference Chihae Yang 28th June, 2006
Acknowledgment • Gilman Veith, International QSAR Foundation • J.F. Rathman, The Ohio State University • Leadscope team • Ohio Technology Action Fund
From Meyer-Overtone to McKim Conference • Narcosis • …”toxicity of neutral organics is related to their ability to partition between water and a lipophilic biphase where molecules exert their activity…” • Model system for partition: olive oil/water. • Evolution Narcosis Non-polar and polar narcosis Reactivity ……
Paradigm shift • How do we strategically leverage? • How do we read across the species, endpoints, structural classes, different knowledge domains? In silico In vitro In vivo Omics
Predictive data mining strategies structural descriptions analogs chemical stressor profile biological/environmental fate Yang, C.; Richard, A.M., Cross, K.P. Current Computer-Aided Drug Design,2006, 2, 1-19.
Steps in predictive data mining Structure, data, graphs, models Visualization SAR & QSAR Profiling Grouping Analysis Hypothesis driven queries Analog searching Read across Searching Chemistry Biology integration Knowledge addition Relational database Platform
Data mining analysis methods Focused Data Sets Compound grouping Analysis QSAR Prediction Classification Rule Extraction Classification Clustering Expert Grouping Pattern Recognition Profiling Large diverse Data Sets
Applying to predictive tox • Profiling “chem-bio” domain • Cut across different knowledge domains • Find hidden signals and relationships from data • Qualify/quantify read-across • Complementary to (Q)SAR • Build hypothesis driven models • Go beyond Yes/No question and answer
Predictive data mining examples • Biological profile • Relationships between fish narcosis and toxicological findings in rat inhalation studies? • Fathead minnow EPA dataset • Rat acute toxicity dataset from RTECS • Thermodynamics consideration
Theoretical bases:Vapor-liquid equilibrium • Non-ideal Raoult’s law: • - The equilibrium distribution between liquid and vapor phases for a chemical species i gi : activity coefficient xi : mole fraction of i in the liquid phase piv : vapor pressure of pure liquid i at the same temperature T yi : mole fraction in the vapor phase.
Study sources for rat and FHM correlations - rat exposure time 2-8 hours - narcosis RTECS 2006 2341 921 • single dose • inhalation • chamber EPA FHM 617 76 • dose unit (mg/mL) • defined LD50 179 LC50 at 96 hr
N N N Representing structures with Leadscope molecular descriptors Benzenes Functional groups Heterocycles Pharmacophores Spacers User defined features
Read-across using structural descriptors profiles of rat organ lesions LC50 FHM Structural descriptors
Quantitative read-across Liver kidney ubl Lung GI pLC50 Rat pLC50 FHM
From a surface scientist point of view • Passive diffusion through lipid bilayer • Headgroup interaction • Hydrophobic tail interaction • Hydrophilic to lipophilic balance (HLB) • Partition model of molecules in lipid layer :
UNIFAC activity coefficient model “residual” term “combinatorial” term molecular volume and surface area effects (size, shape, packing) intermolecular energy effects (interaction) The properties of Gases & Liquids, 4th ed., R. Reid, J. Prausnitz, B. Poling, McGraw Hill, 1987
Advantages of UNIFAC model • Group contribution method • Molecular descriptors-based activity coefficients • Flexibility to vary liquid phases compositions • octanol/water • octanol-water solution/water • hexadecane/water • lipid/water • etc.
O O H Example of activity coefficients in various environment Activity coefficients at infinite dilution can be used to model solubility in various phases.
measured LogP LogP (ow/w) LogP (o/w) LogP (h/w) LogP (dppc/w)
Reflection …We’re committed to nothing less than a point-for-point transcript of everything there is. Only one problem: the index is harder to use than the book. We’ll live to see the day when retrieving from the catalog becomes more difficult than extracting from the world that catalog condenses…. “The gold bug variations, Richard Powers”, 2004
Distribution of LC50s for FHM and rats pLD50 of rats pLC50 of FHM Mean: 1.52 Mean: 0.669