Download
1 / 28
290 likes | 313 Views
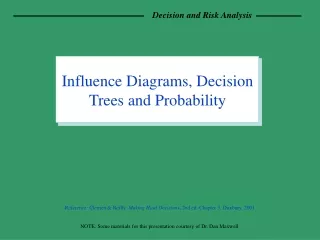
Chapter 6 Decision Trees and Influence Diagrams. Introduction. Decision problems are multi-stage in character when the choice of a given option may result in circumstances which will require yet another decision to be made.

E N D
Chapter 6 Decision Trees and Influence Diagrams
Introduction • Decision problems are multi-stage in character when the choice of a given option may result in circumstances which will require yet another decision to be made. • The decisions made at the different points in time are interconnected. • Influence diagrams offer an alternative way of structuring a complex decision problem and some analysts find that people relate to them much more easily.
Determining the optimal policy • A decision tree consists of a set of policies. • A policy is a plan of action stating which option is to be chosen at each decision node that might be reached under that policy. • For simplicity, assume that monetary return is the only attribute which is relevant to the decision
Assume that, because the company is involved in a large number of projects, it is neutral to the risk involved in this development and therefore the expected monetary value (EMV) criterion is appropriate. The technique for determining the optimal policy in a decision tree is known as the rollback method.
The decision tree suggests the best policy based on the information which is available at the time it is constructed. By the time the engineer knows whether or not the gas-powered design is successful his perception of the problem may have changed and he would then, of course, be advised to review the decision.
If the engineer had wished to include other attributes besides money in his decision model then multi-attribute utilities would have appeared at the ends of the tree.
Decision trees involving continuous probability distributions • In some problems the number of possible outcomes may be very large or even infinite. • Variables could be represented by continuous probability distributions, but how can we incorporate such distributions into our decision tree format?
One obvious solution is to use a discrete probability distribution as an approximation. • The Extended Pearson-Tukey (EP-T) approximation, proposed by Keefer and Bodily.
The value in the distribution which has a 95% chance of being exceeded. This value is allocated a probability of 0.185. • The value in the distribution which has a 50% chance of being exceeded. This value is allocated a probability of 0.63. • The value in the distribution which has only a 5% chance of being exceeded. This value is also allocated a probability of 0.185.
The EP-T approximation does have its limitations. • It would be inappropriate to use it where the continuous probability distribution has more than one peak (or mode). • The approximation would probably not be a good one if the shape of the continuous distribution was very asymmetric.
In some decision problems a subsequent decision depends upon the achievement of a particular level of a variable. • Some successful applications in Pages 152 and 153.
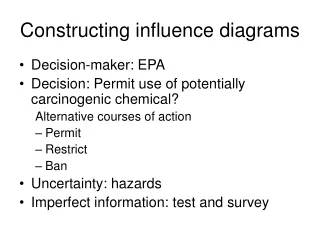
Assessment of decision structure • Imagine that you are a businessman and you are considering making electronic calculators. Your factory can be equipped to manufacture them and you recognize that other companies have profited from producing them. However, equipping the factory for production will be very expensive and you have seen the price of calculators dropping steadily. What should you do?
Eliciting decision structure: One representation of the calculator problem
Structuring is therefore a major problem in decision analysis, for if the structuring is wrong then it is a necessary consequence that assessments of utilities and probabilities may be inappropriate and the expected utility computations may be invalid.
What determines the decision analyst's provisional representation of the decision problem? Generally, it will be based upon past experience with similar classes of decision problems and, to a significant extent, intuition. • Problem representation is an art rather than a science.
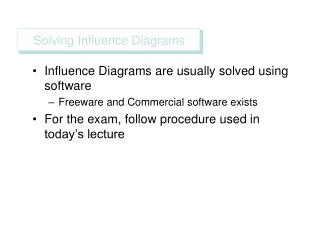
Eliciting decision tree representations • Influence diagrams • designed to summarize the dependencies that are seen to exist among events and acts within a decision. • influence diagrams can be converted to trees. • The advantage of starting with influence diagrams is that their graphic representation is more appealing to the intuition of decision makers who may be unfamiliar with decision technologies.
One step-by-step procedure for turning an influence diagram into a decision tree • (1) Identify a node with no arrows pointing into it. • (2) If there is a choice between a decision node and an event node, choose the decision node. • (3) Place the node at the beginning of the tree and 'remove' the node from the influence diagram. • (4) For the now-reduced diagram, choose another node with no arrows pointing into it. If there is a choice a decision node should be chosen. • (5) Place this node next in the tree and 'remove7 it from the influence diagram. • (6) Repeat the above procedure until all the nodes have been removed from the influence diagram.