Download

1 / 34
350 likes | 380 Views
Decision trees. Decision trees. Originally invented for concept learning (two-class classification) over discrete features But later it was extended to more classes And also to continuous features (here: “attributes”) Also closely related to the learning of logical formulas

E N D
Decision trees • Originally invented for concept learning (two-class classification) over discrete features • But later it was extended to more classes • And also to continuous features (here: “attributes”) • Also closely related to the learning of logical formulas • It has no strict mathematical background, it is based on Occam’s heuristic – a simpler explanation usually generalizes better • It seeks to create a compact and consistent representation for the training data • It was shown (later) that compression is closely related to learning, so creating a compact representation is indeed a good heuristic • The representation will be a decision tree • We will try to build the smallest possible decision tree
Representing the training data with a logical formula • Example task:
Representation by a logical formula • We can represent each Yes row by a conjuction: • And we can connect these by disjuctions: • If the table contains no contradicting examples, then the above formula is true for all positive examples, and negative for all negative examples it is consistent with the training data • We also want the formula to be as small as possible, as this is our heuristics for good generalization • The same truth table may be represented by many logical formulas! How can we find a smallest one?
Reducing the logical formula • How can we reduce the size of the above formula? • We can remove unnecessary evaluations:is equivalent to • When two or more rows contain the same sub-formula, we should avoid evaluating them two or more times: • The idea of joint evaluation leads to the decision tree representation
Representation by a decision tree • This is how a decision tree look like: • Each path from the root to a yes leafcorresponds to a conjunction • The whole tree represents the disjunction of these paths • So the above tree represents the logical formula: • You can also check that the above formula is consistent with the table, however, it is much smaller than the disjunction of conjunctions we created earlier
Construction of decision trees from data • We was how the decision tree classifies an example • We saw that a decision tree corresponds to a logical formula • So, instead of learning formulas, we can learn decision trees • But how can we learn decision trees? • That is, given the table with the examples, how can we automatically create a decision tree? • It should be consistent with the examples • And we also seek to build a small tree • Next, we present the ID3 tree building algorithm of Quinlan (1986) • It builds the tree recursively, from the root to the leaves • It seeks to build a small tree by a greedy attribute-picking strategy • It has several extented versions (see later)
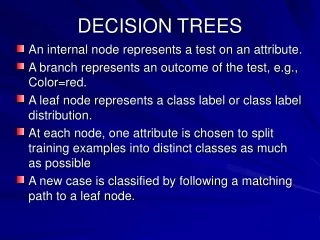
The ID3 algorithm - Summary • We select an attribute for each node (we will discuss later how) • We create branches according to the possible values of this attribute • We also divide the data items according to the actual value of this attribute • We recursively repeat the algorithm for each branch and the corresponding data items • Stopping criterions: • All the data in the branch are positive – create a leaf with label positive • All the data in the branch are negative – create a leaf with label negative • No data in the branch – create a leaf with the most common label at the parent node • No more attributes to test (this means that the data in this branch is contradictory ) – create a leaf with the most common label
How to select the attribute for a node? • We want to build a small (shallow) tree • Building stops when the data in all branches is “clean” – that is, the positive and negative examples do not mix • Our heuristics will be to chose the attribute that gives the largest decrease in the “impurity” of the data • There are many possible ways to formally define the impurity • One possibility is to use the notion of entropy • We will define the information gain as the expected reduction of entropy • At each node, we will calculate the information gain for each attribute, and select the one that gives the largest information gain
Entropy (for 2 classes) • Let S be a set of examples • p+ is the ratio of positive examples (0≤ p+ ≤1) • p - is the ratio of negative examples (0≤ p- ≤1) Entropy (S) –p+log2p+ – p–log2p–[note: 0 log20 = 0] • Example: Entropy ([14+, 0–]) = –14/14 log2 (14/14) – 0log2(0) = 0 Entropy ([9+, 5–]) = –9/14 log2 (9/14) – 5/14log2(5/14) = 0.94 Entropy ([7+, 7–]) = –7/14 log2 (7/14) –7/14log2(7/14) = 1.0
Entropy (for 2 classes) • In general, the shape of the entropy curve looks like • Note that p+ = 1- p – • The entropy become maximal (1.0) when p+ = 0.5 and p- = 0.5so that the positive and negative examples are maximally mixed • This is why it can be used as a measure of “impurity”
The information gain • The information gain is the expected reduction of entropy caused by partitioning the data according to the values of the given attribute • Where v are the possible values of attribute A, and |Sv| is the number of examples in the branch that belongs to value v • At each node with the given S subset of data, we calculate this gain for all attributes A, and select the one that maximizes the above gain
Main properties of ID3 • It was invented for discrete features (involving binary features) • It does not restrict the hypothesis space in advance (has no “modeling assumption”) , so it can create a consistent decision tree for any dataset that contains no contradicting samples • It has a “preference bias”, that is, it tries to put the attributes with high information gain close to the root • The decision for the best attribute is greedy, and there is no backtracking, so the resulting tree is not guaranteed to be optimal (the smallest possible) • The result is easily interpretable for humans (e.g. the tree can be directly displayed or converted to a set of IF-THEN rules) • Not too sensitive to noise (erroneous labels), as the decision for the attributes (the entropy measure) is statistical (uses all data in the branch) • Though it becomes more and more sensitive as we get closer to the leaves
The pruning of decision trees • As we move down in the decision tree, fewer and fewer data samples remain in each branch • We make decisions based on fewer and fewer samples, so individual samples have a larger and larger influence • The chance of making a wrong decision due to e.g. a noisy (incorrectly labeled) example increases • If the data contains no mistakes (e.g. incorrectly labeled samples), the tree building stops only when a perfect decision tree is build for the training data (training error is 0%) • This tree is likely to be overly complex, with many of the leaves assigned based on only a couple of examples • It will quite probably overfit the training data • These are the two main reasons for pruning the tree
The pruning of decision trees • There are two main approaches to reduce overfitting • In both cases we reduce the size of the tree • 1. approach: early stopping of tree building • E.g. do not split a node further when the number of examples in the given branch is below a given limit • Assign a leaf corresponding to the majority of labels • 2. approach: allow the tree to build fully, then post-prune the tree • Try to prune each node by replacing it by a leaf that is labeled according to the majority of labels • Measure the effectiveness of pruning on a validation set • Remove the node that gives the largest increase in the classification accuracy on the validation set • Stop pruning when there is no increase in accuracy
Extensions of decision trees • Extension to continuous attributes • Alternative measures of information gain • Handling training examples with missing attributes • Handling examples with different costs • Most of these improvements are present in the most popular implementation of decision trees called C4.5 (Quinlan, 1993)
Extension to more classes • Fortunately, entropy is defined for more classes • Let X be a discrete random variable with c possible values. Then its entropy is defined as • With this, we can easily modify the information gain function to work for more classes. The other parts of the algorithm require only minimal modifications • Extension to probability estimation • Remember that the (pruned) tree assigns labels to leaves based on the majority of the samples in the given branch • We can easily modify this to return probability estimates for each class, estimated as the ratio of the samples belonging to the given task within the branch
Extension to continuous attributes • We can discretize a continuous variable using thresholds like: (Temperature>10)(Temperature<30) • This way the decision tree building algorithm works just as before • But how can we select the thresholds automatically? • Example for the earlier training data set – with continuous temperature values • Let’s order the examples according to the values of the attribute we want to discretize, and the target label: • Candidate thresholds: the average of the values where the label changes • We add (Temperature<54), (Temperature>54), …to the attribute set • We let the information gain select from these during tree building
Extension to continuous attributes • In the case of continuous attributes the decision tree represents the classes with a union of rectangles that are parallel to the axes: • So theoretically it can approximate regions with arbitrary shape (including disconnected regions) • However, it is not really efficient • When all the features are continuous, I would recommend the use of some classifier directly designed for continuous space (e.g. GMM) • However, it is quite good for discrete features or mixed features
Extension to missing features • What can we do if a feature is missing during testing? • During tree building, we count the number of occurrences for each branch • After building the tree, we create an additional “unknown” path, and label it with the label of the most frequent path • What can we do if there are missing features during training (tree building)? • Let’s build the tree without using the samples that have missing features (we assume that these correspond to the majority of the samples) • From the occurrences of each branch we can create probability estimates (similarly to the method shown above) • We assign the most probable value to each missing feature, then we update the tree by using also the samples with the missing features • There are many other methods for this – more or less sophisticated
Refining the information gain • The information gain fwill prefer attributes that have many values • It will cause problems when some attributes have many more possible values than others • Extreme example: consider the playTennis function with the Date added as an attribute to the training samples • It would be selected as the root, resulting in a very broad tree that creates too many small branches with very few data in each branch • This tree would strongly overfit the training data, and generalize poorly to the test data • We would like to modify the information gain so that it penalizes such attributes
Gain ratio • We introduce SplitInformation: • It measures the entropy of the partitioning of S. More subsets and more uniform division among the subsets results in higher values • Example: SplitInformation for n equally distributed classes: • It increases as n increases • We introduce a new attribute selection metric as: • GainRatio penalizes attributes that create many small subsets
Attributes with different costs • There might be applications where the different features might have different costs (e.g. a medical application) • So during tree building we would like to avoid using the high-cost attributes, or delay their usage closer to the leaves (so that their evaluation would be required only for few test examples) • We can modify the gain function to take the cost into account: • Or
Conversion to rules • The learnt decision tree can be converted into a hierarchy of IF-THEN rules • This has two main advantages • 1. This is useful when human readibility, intrepretability is important • 2. We can also perform the pruning on the rules instead of the tree, and this is more flexible than tree pruning: • Each distinct path through the tree will correspond to a distinct rule • So, we can prune just one path without pruning the whole node • The paths do not require to preserve the order of the attributes, so we can prune attributes from a rule that are closer to the root
Classification and regression trees (CART) • This is the other most popular implementation besides C4.5 • The biggest difference is that instead of entropy, is uses the Gini index as the impurity measure • Gini impurity is a measure of how often a randomly chosen element from the set would be incorrectly labeled if it was randomly labeled according to the distribution of labels in the subset. • And the average Gini index is calculated as • Finally, the Gini gain is calculated similarly to the information gain • Other difference: it can use multivariate decisions • Decisions that are built on more attributes, not just one
The classification error splitting criterion • Another popular splitting criterion • It measures of how often a randomly chosen element from the set would be incorrectly labeled if it was labeled according to the maximum a posteriori decision rule (i.e. the Bayes decision rule) • A Comparison of the Entropy, Gini and classification error criteria for the case of two classes • The curves have similar shapes, and peak at 0.5
Regression trees • How to use decision trees for regression, that is, when the target labels are not classes, but numeric values? • Modifications required to obtain regression trees: • Leaf nodes will return the average value of all instances in this leaf • Splitting criterion: • We minimize the variance of the values within each subset Si • The splitting criterion will be the standard deviation reduction (remember that we have no class labels!) • Early stopping of tree building (don’t want single points in each leaf) • Lower bound on the standard deviation in each node • Lower bound on the number of examples in each node • Pruning: with numeric error measures like the mean squared error
Multivariate decision trees • The the case of continuous features, applying decisions based one exaclty one attribute results in decision boundaries that are built from lines parallel to the axes (see green curve and decision tree) • We could obtain a much smaller tree if we could create multivariate decisions (see blue curve and tree)
Multivariate decision trees • These are the so-called multivariate decision trees • The decisions are formulated as weighted linear combinations of the attributes (see figure) • The decision surfaces are still built from lines, but not necessarily lines parallel with the axes • Unfortunately, the tree-building procedure becomes much more complicated • We have to examine allpossible feature combinations • For more details, see:http://legacydirs.umiacs.umd.edu/~salzberg/docs/murthy_thesis/survey/node11.html