Download
1 / 45
460 likes | 470 Views
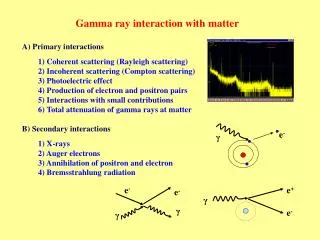
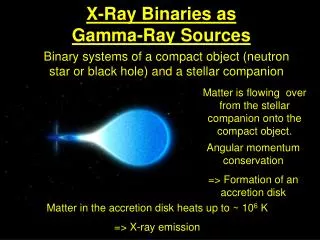
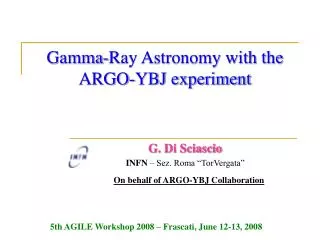
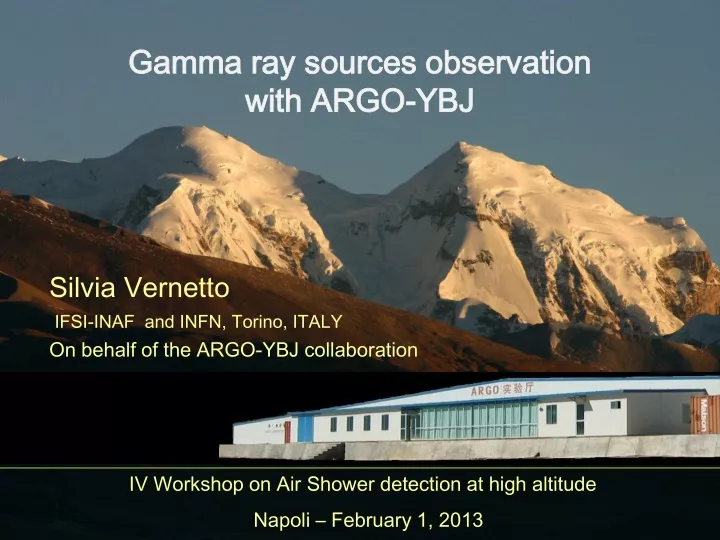
Gamma ray sources observation with ARGO-YBJ. Silvia Vernetto IFSI-INAF and INFN, Torino, ITALY On behalf of the ARGO-YBJ collaboration. IV Workshop on Air Shower detection at high altitude Napoli – February 1, 2013. Tibet AS γ. ARGO. The Yangbajing Cosmic Ray Laboratory Tibet - China.

E N D
Gamma raysourcesobservationwith ARGO-YBJ Silvia Vernetto IFSI-INAF and INFN, Torino, ITALY On behalf of the ARGO-YBJ collaboration IV Workshop on Air Shower detection at high altitude Napoli – February 1, 2013
Tibet ASγ ARGO The Yangbajing Cosmic Ray Laboratory Tibet - China 4300 m a.s.l. Longitude 90° 31’ 50” East Latitude 30° 06’ 38” North
The ARGO-YBJ detector The PAD(56 62 cm2) is the space-time “pixel” Time resolution 1 ns ARGOhas18480PADs Single layer of RPCs detectors • Central carpet 78 x 75 m2 (95 % of active surface) • Sampling ring • 111 x 99 m2 • (20 % of active surface) Trigger requirement: at least 20 particles on the carpet
Recorded Data • Trigger: 20 particles • Rate ~3.5 kHz - Dead time 4% • First data in July 2006 • Stable data taking since November 2007 • Stop operation in February 2013 > 5 years of data • Final results within 2 years
Showers data • Shower core reconstruction Maximum Likelihood Method applied to the lateral density profile of the shower • Fit of the shower front Primary direction Space and time coordinates of the fired PADs
The Moon shadow An important tool to check the detector performances Deficit: > 70 standard deviations 9 standard deviations /month Physics:antiproton / proton ratio in cosmic rays ARGO coll., Phys.Rev. D 84 (2011) 022003 ARGO coll., Phys.Rev. D 85 (2012) 022002
The Moon shadow Energy calibration West displacement of the shadow caused by the Geomagnetic field Bending 1.57° Z / E (TeV) Angular resolution Error in energy scale 13%
Gamma Ray Astronomy with ARGO • Energy threshold: few hundreds of GeV Overlaps with Cherenkov detectors • Integrated sensitivity in 5 y at 1 TeV: 0.26 Crab No gamma-hadron discrimination C.R. background evaluation with an error < 10-3 • Large field of view: ~2 sr • Large duty cycle: 86% First sky survey at ~1 TeV at decl. from -10° to 70°
Gamma Ray sources Galactic sources Extragalactic sources • Crab Nebula • MGRO J1908+06 • Cygnus Region • HESS J1841-055 • Mrk 421 • Mrk 501 new
Crab Nebula 18 s PSF in agreement with MC Nhit >100 HST (0.5 – 10) TeV
MILAGRO GalacticPlanesurveyat 20 TeV MGRO J2031+41 MGRO J1908+06 MGRO J2019+37 Cygnus region Abdo et al., 2007 3 extended sources associated with FERMI pulsars
MGRO J1908+06 ARGO HESS (2009) 6.2 s HESS extension0.34°±0.04° Inside the nebula FERMI detected a pulsar with period 106.6 ms ARGO extension 0.49°±0.22°
MGRO J1908+06 spectrum F (> 1 TeV) = 69% Crab Flux in agreement with Milagro but higher than HESS by a factor 2-3 Contribution from the Galactic diffuse gamma ray flux < 15% dN/dE = (6.1 ± 1.6) 10-13 (E/4 TeV) –2.54 ± 0.36 ph sec-1 cm-2 TeV-1 ARGO coll., ApJ 760, 110, 2012
MILAGRO GalacticPlanesurveyat 20 TeV MGRO J2031+41 MGRO J1908+06 MGRO J2019+37 Cygnusregion Abdo et al., 2007 3 extended sources associated with FERMI pulsars
The Cygnusregion • One of the more activeregion in the Galaxy • High star formation rate • OB associations • Supernova Remnants • Wolf-Rayetstars • Ionized Gas • High diffuse Gamma Rayflux MGRO J2019+37 MGRO J2031+41 MILAGRO VERITAS Abdo et al., 2012
Cygnusregion by ARGO MGRO J2031+41 MGRO J2019+37 Abdo et al., 2012
Cygnusregion by ARGO MGRO J2031+41 MGRO J2019+37 MILAGRO Abdo et al., 2012
Cygnusregion : MGRO J2031+41 spectrum F (> 1 TeV) = 31% Crab Flux in agreement with Milagro but higher than MAGIC and HEGRA by a factor 10 Contribution from the Galactic diffuse gamma ray flux < 10% dN/dE = (1.40 ± 0.34) 10-11 (E/1 TeV) –2.83 ± 0.37 ph sec-1 cm-2 TeV-1 ARGO coll., ApJL 245, L22, 2012
Cygnusregion : MGRO J2019+37 upperlimits No significant signal observed by ARGO Very hard spectrum ! ARGO coll., ApJL 245, L22, 2012
HESS J1841-055 region with ARGO new Unidentified HESS source HESS extension: 0.4° 0.25° No obvious counterpart Maybe it is composed by different sources Hadronic scenario ? 5.3 s High zenith angle: culmination at 35.7° ARGO coll., submitted to ApJ
HESS J1841-055 Flux higher than HESS by a factor of 3 Contribution from the diffuse Galactic gamma ray flux < 4% dN/dE = (9.6 ± 1.6) 10-13 (E/5 TeV) –2.32 ± 0.23 ph sec-1 cm-2 TeV-1
Source spectra • CRAB point source flux agrees with ACTs • MGRO J1908+06 extended flux ~2-3 ACTs • MGRO J2031+41 extended flux ~5 -10 ACTs • HESS J1841-055 extended flux ~3 ACTs Systematic disagreement for extended sources ! ARGO (and MILAGRO) measure higher fluxes
Crab Nebula flaresat E > 100 MeV Fermi data from Buehler slides – Fermi Symposium 2011
Search for flares of duration 1-20 days in 3 years Significances distribution of the excesses in all the time intervals from Nov. 2007 to Feb. 2011 after steady flux subtraction for events with Nhit > 40, 100, 500, 1000 Gauss fit <s> = 0.0210.004 s.d. r.m.s. = 0.9830.003 c2 = 27 (16 deg. of freedom) No significantflarefound in 7×10⁴ trials
September 2010 flare ARGO during the 3 Fermi spikes 3.1 s signal for events with > 40 hits ( E 1 TeV) expected 0.55 s from steady flux FERMI 3 spikes Cherenkov data Balbo et al. A&A 527 L4, 2010
April 2011 flare AGILE light curve E > 100 MeV ARGO during 6 days 4 s signal for events with > 500 hits (E 10 TeV) Expected: 0.47 sfrom steady flux Post trial chance probability 2 × 10⁻² 6 days No Cherenkovmeasurements
July 3 2012 flare On July 3 Fermi observed an increase of the Crab Nebula flux by a factor of 2 ARGO on July 3 3.5 s at the Crab position for events with > 100 hits Expected 0.33 sfrom steady flux Post trial chance probability < 10-2 No Cherenkovmeasurements
Mrk 421 - X ray light curve ARGO-YBJ RXTE 2 – 12 keV Mrk421 X-ray light curve Full ARGO start data taking November 2007
Mrk 421 - the first source observed by ARGO δ(deg) ≈ 6 s.d. r.a. (deg) July 2006 flare ARGO Test Data 2006 July 6 – September 2 (110 hours) Flux 3-4 Crab No Cerenkov measurements
Mrk 421 - June 2008 flare OPTICAL Multiwavelenght observations : • GASP-WEBT (R-band) • Rossi RXTE/ASM (2-12 keV) • Swift/BAT (15-50 keV) • SWIFT (UVOT & XRT; June 12-13) • AGILE (E > 100 MeV; June 9-15) • MAGIC and VERITAS (E> 400 GeV; May 27 - June 8) SOFT X-RAYS HARD X-RAYS GAMMA RAYS 2 flaring episodes: June 3-8 and June 9-15 X rays hardness ratio No Cherenkov data after June 8 Donnarumma et al. (2009)
Mrk 421 - June 2008 flare Flux (E > 1 TeV) ~ 6 Crab 3 days average 1 day average Power law spectrum + EBL absorption : dN/dE = (3.2 1.0) · 10-11 (E/2.5) –2.1 0.7 e-t(E) ev cm –2 s –1 TeV –1 ARGO coll., ApJL 714, L208, 2010
Mrk 421 - February 2010 flare 16-18 Feb. 16 Feb. • ARGO observed a strong flare on 16-18 Feb. at 6 s.d. • Flux > 3 Crab Peak flux (16 Feb) > 10 Crab • For the first time an EAS array observed a TeV flare at 4-5 s.d. in one day • VERITAS reported similar observation in Atel #2443. 6 s.d. 17 Feb. 18 Feb.
Mrk 421 - 2010 flares multiwavelenght observations RXTE – SWIFT – FERMI - ARGO February 14 - 23 5 days average RXTE – SWIFT – FERMI - ARGO 5 days average April 25 - May 2 February 16 April 28
Mrk 421 - 3 years correlation with X rays Cumulative counting rate Active periods TeV grays ARGO X- rays 2-12 KeV RXTE/AMS X –rays 15-30 KeV SWIFT/BAT ARGO coll., ApJ 734,110, 2011
Mrk 421 – 3 years correlation between X rays and TeV gamma rays Correlation coefficient vs. time lag RXTE & ARGO Daily counting rates Time lag consistent with zero
Mrk 421 – 3 years correlation Spectral features Spectral index vs. flux TeV flux vs. X-ray flux by Whipple The X ray and TeVspectrahardenincreasing the flux The relation betweenTeV and X-rayfluxesisquadratic
Mrk 421 Spectral modeling One-zone SSC model (Mastichiadis & Kirk,1997, Yang et al., 2008)
Mrk 501 - October 2011 flare Swift BAT (15-50 KeV) After 14 years a new strong X-ray flare FERMI (>300 MeV) ARGO-YBJ (TeV) TeV emission detected by ARGO-YBJ No Cerenkov measurements
Mrk 501 Quasi-steady emission 3.2 years August 2008 - October 2011 Flare : 17 Oct – 22 Nov 2001 6 s.d. Average flux: 0.3 Crab Flare flux : 2.1 Crab
Mrk 501 SED flare SSC model ARGO data during flare are not consistent with a one-zone SSC model The long term emission is consistent with a one-zone SSC model ARGO coll., ApJ 758, 2, 2012
Summary In 4.5 years of observation : • Crab Nebula : spectrum in agreement with other experiments • Some excess in coincidence with flares • MGRO J1908+06 : measured extension and spectrum • observed flux larger than HESS flux • MGRO J2031 +41- observed flux larger than MAGIC & HEGRA flux • MGRO J2019 +37 - not observed • HESS J1841-055 – observed flux larger than HESS flux • Mrk421 : - continuouslymonitored - VHE flux correlated with X-rays - observed flares in 2006, 2008, 2010 - flare on Febuary 2010 detected in only one day • Mrk501 : - new strong flare in 2011