Download
1 / 17
170 likes | 314 Views
EAS Time Structures with ARGO-YBJ experiment. XXIII European Cosmic Ray Symposium, ECRS 2012 Moscow , Russia, July 3-7, 2012. A.K Calabrese Melcarne 1 , G.Marsella 2 for the ARGO-YBJ Collaboration. 1 - INFN-CNAF, Bologna, Italy 2 - Universit à del Salento and INFN Lecce, Italy.

E N D
EAS Time Structures with ARGO-YBJ experiment XXIII EuropeanCosmic Ray Symposium, ECRS 2012 Moscow, Russia, July 3-7, 2012 A.K Calabrese Melcarne1, G.Marsella2 for the ARGO-YBJ Collaboration 1 - INFN-CNAF, Bologna, Italy 2 - Università del Salento and INFN Lecce, Italy
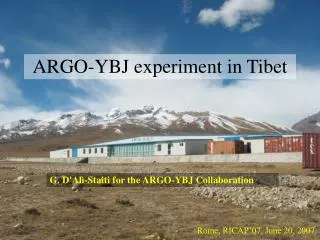
The ARGO-YBJ experiment ARGO-YBJ High Altitude Cosmic Ray Laboratory @ YangBaJing,Tibet, China Site Altitude: 4,300 m a.s.l. , ~ 600 g/cm2
99 m 74 m 8 Strips (6.5 x 62 cm2) for each Pad 10 Pads (56 x 62 cm2) for each RPC 1 CLUSTER = 12 RPC (43 m2) 78 m 111 m RPC Strip = space pixel Pad = time pixel Time resolution ~1.8 ns analog charge read-out dynamical range up to ~ 104 TeV
Number of Fired Strips Data Analysis - Core reconstructed within the central carpet - Quality cut on S2 contamination of mis-reconstructed events less than 10% at low multiplicity, rapidly decreasing at higher multiplicity Reconstruction Time sequence and position of hit pads used to reconstruct the CR arrival direction and core position • Using a plane (α=0) • Using a conical correction (α0) Full coverage, high time and space resolution provide a detailed view of shower front
Timeprofile Average Curvature:the meanoftimeresidualsΔt(R)withrespectto a planefit 7.9 108 events • larger than 10 ns for particles landing further than 60 m from the core. • no significant dependence on pad multiplicity observed. zenith < 15°
Data vs Simulations Shower generator Corsika 6.720 with SIBYLL+FLUKA as hadronic interaction models at high and low energies ~ 107 proton showers dN/dE E- (=1) 300 GeV - 100 TeV Detector simulationGEANT3 curvature zenith < 15° Very good agreement at the level of time profile
Large RMS Showerfronts • In orderto exploit at maximumspace-time information, westarted a detailedstudy on the longitudinaltimestructures in data • The idea istostudy more in detail the showerstructures in ordertodefineselectioncriteriaforparticularanalysis (gamma/hadronseparation, composition, exoticphysics) • In particularwestudiedshowerswithlargetimeresidualwithrespectto the showerfront • TwoCategorieshavebeenobserved Wide showers Double Front showers
DoubleShowerFronts New Selection • Hit Number >100 (10% of Ev.) • Fiton timedistribution • UsedTSpectrumclassofroot Reconstruction • Separation of subshowers • Planar Fit on subshowers • Quality cuts on reconstructed subshowers • S2 < 100 ns2 Distance of two peaks > σ1+σ2
DoubleShowerFronts • What are these showers? accidental coincidences and possible delayed showers • How many events? • How many are compatible with accidental coincidences? • Angular difference distribution • Nhit Distribution • Time delay • Observed vs Expected events
AngulardifferenceDistribution Angular differencebetween the reconstructedsubshower directions In agreement with CR distribution of consecutiveevents
MultiplicityDistribution Multiplicity distribution of the reconstructedsubshowers Shower 1 is the one whichtriggers the detector! We expect lower multiplicity distribution from shower 2 (triggernot required)
TimeDistance How to define time distance between two subshowers? • At least 2 variables: • Peak mean value • T0 from the shower plane Fit
TimeDistance Both variables can be used as indicator
ReconstuctedAngles Applying a planar fit, the direction of both subshowers is reconstructed Quality requirements on subshowers reconstruction are applied (S2<100ns2)
Analysis Expectedrates • DAQ rate = 3.5±0.1 kHz (multiplicityofEventsNhit > 20 in a timewindowτ = 2 μs) • Rate ofobservedshowerswith S2 < 100 ns2 : λ1= 2.7±0.1 kHz • Expecteddoublecoincidences: λexp = 2 λ1 λ1τη = η (28±1) Hz (η is the eventselectionefficiency) Observed rates • 7.9 x10⁸ events have been processed • 700 x103 events selected as double coincidences • 370 x103 events selected as double coincidences with quality cuts on subshowers 4.5x10⁻² % of the events (1 orderofmagnitudelessthanexpectedifη=1 ) η x 0.8% of the events
Analysis Simulateddoubleevents • ArtificialdoubleEventshavebeengeneratedfromreal data • Mergedtwo consecutive eventsshifting the timeofeach hit of the secondeventby a randomlyextractedΔT compatiblewith the 2μs trigger window • Verified the randomdoubleshowerdistributions (Angle, Multiplicity, relative timedistribution) • Tested the doubleshowerselection and reconstructionefficiencyη: The efficiency ηis 5% (preliminaryselectionalgorithm) Thisexplains the differencebetweenexpected and observedevents expected : η x 0.8% = 4.0x10⁻² % of the events observed : 4.5x10⁻² % of the events
Conclusions In this work the shower time profile and distribution have been presented. The curvature of the showers around the core have been studied, illustrating the reconstruction effect on ARGO-YBJ data. Longitudinal time structures have also been investigated selecting events with large time distribution around the shower front. The attention has been focused on double front showers and , in particular, to identify the expected random double coincidences. A new algorithm have been introduced, increasing the detection efficiency. More efforts are on the way. The detailed study of the angular and time distribution of the selected events will be useful in studying possible shower anomalies. In particular narrow Angular difference events will be analyzed on large statistical sample in order detect anomalies in spatial, time and multiplicity distributions as a flag of possible ‘exotic’ physic events in CR. This is a preliminary step to better investigate the possible “physics of multiple shower fronts”