Download
1 / 46
480 likes | 738 Views
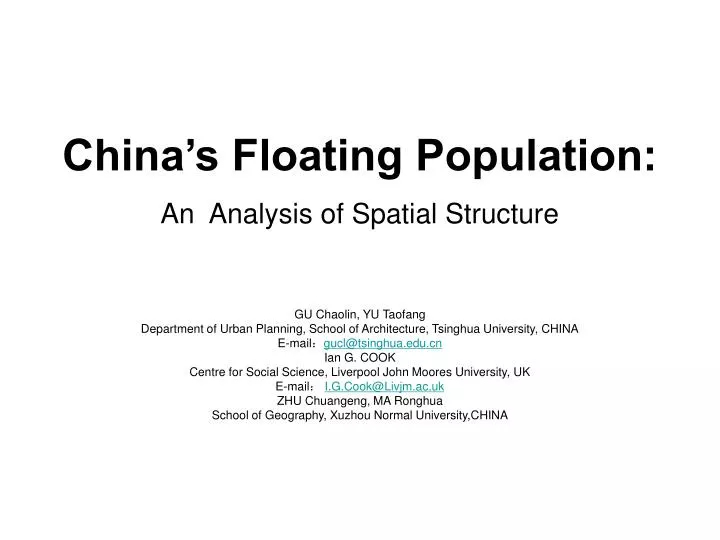
China’s Floating Population: An Analysis of Spatial Structure. GU Chaolin, YU Taofang Department of Urban Planning, School of Architecture, Tsinghua University, CHINA E-mail : gucl@tsinghua.edu.cn Ian G. COOK Centre for Social Science, Liverpool John Moores University, UK

E N D
China’s Floating Population:An Analysis of Spatial Structure GU Chaolin, YU Taofang Department of Urban Planning, School of Architecture, Tsinghua University, CHINA E-mail:gucl@tsinghua.edu.cn Ian G. COOK Centre for Social Science, Liverpool John Moores University, UK E-mail: I.G.Cook@Livjm.ac.uk ZHU Chuangeng, MA Ronghua School of Geography, Xuzhou Normal University,CHINA
Abstract • This paper begins with a critical review of researches on the Chinese floating population. Then, based on floating population data in 1996 from the Ministry of Public Security of China, it moves on to analyze the factors underlying the spatial transformation and spatial structure. The authors discover that two factors in particular, economic growth and city investment, underpin the spatial transformation of the urban floating population.. • Keywords: China’s Floating Population, Spatial Transformation, Influential Factors, Spatial Structure, GIS analysis, Spatial Divisions.
I. Introduction • 1. Definition of Floating Population • 2. Overview of researches on the Chinese floating population • II. Critical Literatures Review on Migration • 1. Geographical approaches • 2. Economic approaches • 3. Sociological and psychological approaches • 4. Quantitative approaches • III. Research Assumption and Data Availability • 1. Research assumption • 2. Data availability • IV. Analysis of Influencing Factors • 1. Three-dimensional Spatial Model • 2. Spatial auto-correlation analysis • V. Spatial Division and Fundamental Characteristics • VI. Discussion and Conclusions
Introduction • The People’s Republic of China has witnessed big changes in the last two decades. Spatial transformation has been wide-scale and far-reaching, with economic growth in China’s ‘Gold Coast’ reaching unprecedented levels, especially in the cities. An important feature of this spatial transformation has been the freeing up of previous restrictions on population mobility (Scharping, 1997), to the extent that China’s floating population has become one of the most remarkable phenomena to bear witness to the changing nature of China’s population structure. Perhaps an inevitable outcome of the shift to a market economy, this phenomenon of the floating population significantly affects the progress of social and economic development.
Definition of Floating Population • Operational definitions of migration are tedious affairs comprising five dimensions: legal status, time, space, activity and actor. • In China, whereas it was used in the nation-wide establishment of the household registration(HUKOU) system after 1958 and the tightening of policy in the early 1960s limited the meaning of migration to persons moving with permission to change their place of permanent household registration. • “ Floating population (Liudong renkou)” is a very broad category that covers a diverse bundle of people such as tourists, people on business trips, traders, sojourners, and peasants in the cities, both employed and unemployed (Chan, 2001). It refers to population moving to or staying in cities, towns or townships other than the place of permanent household registration. These people could account for as much as 20-25% of Chinese population.
There are too many literatures on migration since human being has a long history of movement and migration. With his “Laws of Migration” published in 1885 and 1889, Ernst Georg Ravenstein is the ancestor of all attempts at migration model building. • Although his rough sketch of general trends in migrant behavior does not justify the claim to elaborate universally valid “laws of migration”, it provides some applicable points today, such as, migration decreasing with the distance between two places. Geographical, economic, sociological and psychological, quantitative approaches have focused on different aspects of migration.
1. Geographical approaches • Economic geographers Walter Christaller and August Losch with their theories of central places and standard market areas have broken ground for an understanding of rural-urban linkages and movement caused by the availability of crucial goods in a hierarchically ordered system of urban settlements. Other geographical approaches in migration studies are represented by the “gravity” models developed by Zipf, Stouffer and Lowry, which have been elaborating on the function of spatial distance and city size in population movement. • William Skinner had got his inspire by his work and described the market areas in rural Sichuan, China in 1940s, and then his research on the role of regional systems extended to the whole of China.
Urban hierarchies are the major sources of hampering forces of migration in China. Migration is not only a horizontal occupational mobility, but also a hierarchical movement desired by most would-be migrants. Geographical and occupational migration is a market driving practice in which people migrate in search of better paid jobs, whereas hierarchical migration is rent-seeking practice by which people migrate to change their entitlements of access to a set of welfare provision. Here, we can list a host of differentials in welfare provisions between rural and urban areas and between smaller and larger cities (housing subsidy, pension provision, health care, job security, price subsidy etc.). Therefore, current migration in China is a two-goal practice. People move to search both market-determined betterment and hierarchy related benefits.
2. Economic approaches • The great majority of migration studies have documented the overwhelming importance of economic factors. Basic among them is economic structure in regard to shares of the primary sector, the various branches of industry, construction and the tertiary sector. Market access can be a major determinant of living standards as well as a direct cause of population movement. Another important economic factor is the volume and distribution of investment. • However, there are also sectors such as trade, transportation and a number of services that can generate employment without large outlays of capital. Following this kind of light, we discuss the migration theories in economic approaches as following three assumptions: labor market, capital flow and human capital.
In China, the curve interrelated between inter province labor migration (1990's state census) and FDI (1979-1990) in each province showed the dynamic relationships between migration and FDI (Figure 1).
3. Sociological and psychological approaches • Economic approaches suffer from such defects as they operate with better defined and easier to quantify variables such as investment and growth rates in the non-agriculture sector, wage levels, employment figures and labor productivity. In particular, they were unable to explain why some people left their rural areas of origin while others stayed. • Furthermore, regional population dynamics and structure are an indispensable element of understanding. Besides absolute numbers determining population density, man-land-ratios and land use, fertility levels, age structure and household composition seem to be of special significance.
3. Sociological and psychological approaches • They are intimately connected with social structure involving groups defined by family relationships, occupation, income and property. White-collar professions, specific household types and income groups seem to have a particularity great propensity for migration. Educational attainment has been shown to exert a clearly recognizable influence on migration behavior, too. • One variable not mentioned by Lee but of paramount significance is the role of kinship ties. Stark and Bloom gave an interpretation of migration in the light of new economics.
In China, migrants tended to cluster in younger age groups entering the labor force and getting married. The majority of the qualification is most opportune for the Chinese case where political variable, legal regulations and information policies of the state have greatly influenced migration patterns, while personal networks have worked as a major force of circumvention and facilitation. In Lee’s list, only transportation costs can be discounted as a major of obstacles for migration in China.
4. Quantitative approaches • It is in recognition of this problem that more recent version of the migration theories and models have stretched many aspects such as differences in economic structure, labor market, social relationship, leisure time or housing conditions between places of out- and in-migration. A further question has been how to quantify and package a constant formulas group that has been worked into all factors and variables in order to express all parts of migration referred to above. Such factors would be important items as, for instance, geographical, economic and social structure, life cycles or different development level. Scharping (1997) gave a model which try to reconcile the analysis of macro-level data for the geographical, economic, demographic and social setting with the study of migration decisions on the micro-level of individual and household behavior.
Quite obviously, here the model would show great differences between various periods of China’s history. Migration dynamics there resemble Western patterns much closer. They reflect the wide social distance that has developed as a result of different economic and political conditions.
1. Research assumption • However, these Western migration theories and China’s real situation have been anything but consistent. China have smacked heavy does of ideology and preoccupation with the own historical record and have had to be constantly adapted to new developments. Many economic theories have started from the basic assumption of the homo-economics, simplified to a rational maximize of profit and utility, acting in an open political system and a free market framework of full information and equal chances.
It is these migration theories and models that need modification even more thought they accumulated so far stimulate an attempt at synthesis in a migration model for China. The increasing complexity of formulas, however, has been offset by their decreasing suitability to account for temporal change. At best, they can elegantly sum up cross-sectional analyses.
2. Data availability • Chinese censuses and micro-censuses have adopted compromise solutions for counting population and classifying it by places. Thus, floating population having left their permanent registration place for more than one year plus more recently departed persons with fixed new abodes were included among the inhabitants of their actual place of stay. The censuses of 1982 and 1990 embrace either a permanent household registration independent of residence permanency or a minimum residence of one year with registration elsewhere. The micro-censuses of 1987 and 1995 reduced the minimum time requirements for persons with registration elsewhere to 6 months. This category of people exclude holders of provisional registration status “temporary registration population (Zanzhu Hukou)”, no matter how long their duration of stay.
China’s regulations required for all persons staying outside their permanent home to register themselves again within three months. However, surveys of floating population in some major cities result in 30- 50% of the respondents without permanent registration there staying longer than one year. Some local surveys in rural areas have hinted at up to 80% of rural-urban migrant workers without provisional registration. Another problem is that numbers for provisional registration actually do not define persons but rather records.
3 Floating population data in 1996 • Based on floating population data for 1996 supplied by the Ministry of Public Security of China, we shall explore these influential factors at the national scale. Also, via use of the visualization technique of GIS and the integrated methods, deeper analysis will be made concerning the spatial structure of the floating population in China.
The data in 1996 contains the national distribution of floating population for all 3406 counties, cities and districts in metropolis. The data provides the total number of floating population, the male/female sex ratio, the length of dwelling time in the new location, and living conditions of the floating population. The data set also provides reasons for migration, the occupation of floating population as workers, farmers, in commerce, services, on official business, temporary studying and training, housekeeper or baby-sitter, visiting relatives, or tourists, meetings and other activities.
In order to analysis the data-set was reorganized as follows: (1) Data in the urban areas (their boroughs or counties included). Based on these statistics, the outcome is a general table of 146 city areas where the floating population exceeds 50 thousand persons. (2) Full data-set of counties or the central city: The first rows of each questionnaire for the more than 3000 counties and central city is picked up, and then comes the general table of the floating population in the counties and central cities nationwide.
Statistics show that the floating populace in 1996 was 28.8% of the total population in China. The cities are the concentration “highlands” both for the economy and for the floating population.
Table 2: Correlation analysis between size and factors Note:(1) In the column of the testing result, the symbol ‘*’ represents significant correlation at the 0.01 level. (2) Size means the size of the urban floating population; and factors are urban integrated factors
Table 2 shows that the urban economic growth and the urban investment are two main factors influencing the urban floating population in China. The migration of the floating population to urban areas mainly depends on the conditions of the economic growth and the investment level, i.e., the growth of new jobs. • Another two dimensions, the urban social development and the urban consumption for the population floating, are remarkable.
At first, the roles played by urban social development are relatively small, which illustrates that the movement of Chinese floating population is still in its elementary stage, i.e., survive strategy stage. • Secondly, that urban consumption plays only a minor role in the process of the population floating. • These mean that the most important things for Chinese urban floating population are to get jobs and have some work opportunities while they enter the cities. It is not pressing goals for these migrants to improve their present living standard. • From the “consumption pulling” perspective we can see, the population floating has not become a “force” for the development of the cities.
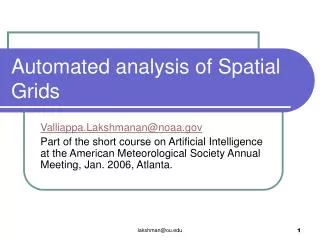
We extracted data of the layer for the administrative unit such as the county and the city in the Database of the Chinese Resources and Environments (1:4,000,000 series), and this is then used as the graphics data for the study of the Chinese floating population.
Figure 3: Three-dimensional model of the floating population in China Note: To increase the visual effects and to avoid the blocking impact of the Pearl River delta area, the observation angle is adjusted correspondingly.
The model of the spatial auto-correlation analysis (1) Moran I: the model of the whole spatial auto- correlation analysis
Figure 5: Analysis of spatial auto-correlation on the floating population in China
In order to depict the spatial structure of the Chinese floating population macroscopically, we extend further the studied unit of the floating population into the provincial level. Based on the outcomes of Figure 5, the spatial auto-correlation on the county level is classified and reassembled to the provincial level as Table 3 demonstrates.
Table 3: Classified Areas of the Spatial Auto-correlation of the Floating Population in China’s Provincial Level (%) Note: (1) Counted by area proportion of provincial-level units; (2)The bold italic numbers in the table represent that province, city or borough area where the area is bigger than the average of its correspondence in the country as a whole.
According to this interpretation, the Chinese national floating population 1996 can be divided into three clusters and five areas, illustrated in Figure 6.
The spatial transformation factors of the urban economic growth and the urban investment are the main driving forces for the movement of the floating population of China. The locations where rapid economic development and associated investment continue apace are a great attraction to migrants from within the rural areas of these provinces as well as to those from other parts of China.
The cities, especially in eastern China, are the concentration areas of the floating population. In these areas, as the most urbanized area in China, the Pearl River delta and the Yangtze River delta are also the concentrated “highlands” of Chinese floating population. The second structural element is the existence of an outstanding “tripartite” structure between the east, the middle and the west of China. The east displays the concentration areas for the floating population, the middle a less dense area and the west a sparse area, while the frontier regions have relatively more floating population.
In all, the Chinese floating population makes both a significant contribution to, and is itself affected by, the massive spatial transformation that China is undergoing. The resultant structural change is still in its infancy, but will develop further to pose new questions for researchers and policy-makers alike, as China strives to incorporate this huge movement of people into its burgeoning cities.