Download
1 / 26
270 likes | 374 Views
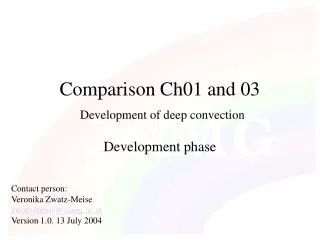
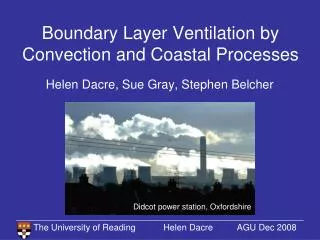
Suppression of Deep Convection by the Saharan Air Layer (SAL) over the Tropical North Atlantic Sun Wong 1 , Andrew E. Dessler 1 , Peter Colarco 2 1 ESSIC, University of Maryland, College Park 2 Goddard Space Flight Center, Maryland, Greenbelt March 24, 2005 (MODIS Meeting). Easterlies. 5 km.

E N D
Suppression of Deep Convection by the Saharan Air Layer (SAL) over the Tropical North Atlantic Sun Wong1, Andrew E. Dessler1, Peter Colarco2 1ESSIC, University of Maryland, College Park 2Goddard Space Flight Center, Maryland, Greenbelt March 24, 2005 (MODIS Meeting)
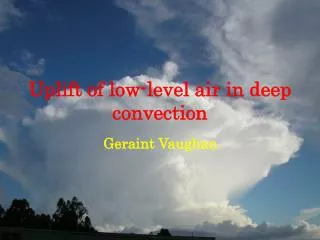
Easterlies 5 km Saharan Air Layer Warm Dry Dusty 0.9 km Cool, moist Africa Atlantic
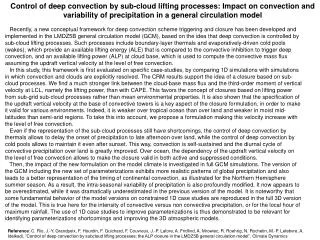
Why does the SAL concern us? • Evidence has shown linkage between the SAL and the tropical cyclone (TC) activity • The SAL is associated with the transport and distribution of dust over Atlantic. Dust can cool the surface and warm the atmosphere (Global mean forcing at surface from dust: –0.96 Wm-2)
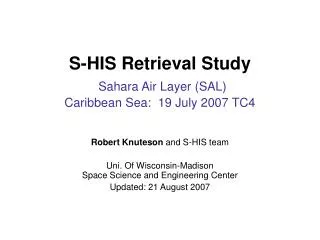
Purposes • Using NASA’s satellite data (including MODIS) to study the thermodynamic structure of the SAL • Evaluate simulation of the SAL by NASA’s model (fvGCM) using the satellite data • Understanding the detailed physics using the model
Data Resources • MODerate resolution Imaging Spectroradiometer (MODIS) aerosol optical thickness (AOT,0.55 µm, MOD04 level-2 product from Terra) • Brightness T (11 µm, MOD06 level-2 product) • NCEP/NCAR Reanalysis T, RH (2.5°×2.5°) • Time: Daily instantaneous samples at around noon for Aug-Sep 2002 • Region: 40°-20°W, 10°-20°N
For each grid and each day in the region 1° • Grid-averaged AOT 10 km AOT • BT histogram • Total BT pixels no. > 100 1° BT 1 km Range: 190-300 K Bin width: 10 K
Regional Statistics for Aug-Sep 2002 0-0.3 0.9-3
Composites of T Anomaly Profiles 0.3-0.5 0.9-3 0.3-0.5 0.5-0.7 0.7-0.9 0.7-0.9 0.5-0.7
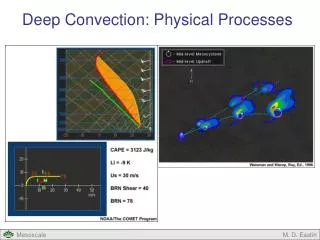
CAPE and Convection Barrier LNB A: Energy released in convection B: Convection barrier CAPE = A – B Altitude A Lifted LFC SAL T B Air parcel T LFC Non-SAL T LCL Virtual Temperature
Conclusion • The SAL is associated with a suppression of deep convection. Frequency of clouds with BT less than 250 K is largely reduced • The SAL suppresses deep convection by lifting the LCL (less moisture), LFC (warmer temperature), and strengthening the convection barrier
GOES SAL Tracking Imagery, BT11-BT12 (Dunion and Velden, 2004)
For each grid and each day in the region 1° • Grid-averaged AOT 10 km AOT 1°
Regional Statistics for Aug-Sep 2002 East Atlantic (Region 1):
Composites of T Anomaly Profiles 0.9-3 0.3-0.5 0.5-0.7 0.7-0.9
CAPE and Convection Barrier LNB A: Energy released in convection B: Convection barrier CAPE = A – B Altitude A B Air parcel T LFC Environmental T LCL Virtual Temperature
Discussion and Future Direction • How about the wind shear at the southern border of the SAL? • Are dust and warm anomalies really advected coherently? • The quality of NCEP/NCAR reanalysis? (Especially moisture!!!)