Download
1 / 14
140 likes | 226 Views
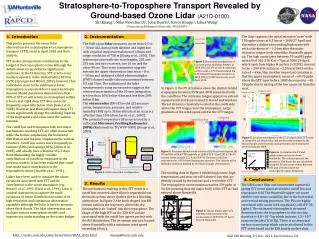
Evaluation of Tropospheric Ozone Derived from Scan Angle Geometry Method (SAM). Jae H. Kim 1 , Sunmi Na 1 , and Mike Newchurch 2. 1; Department of Atmospheric Science, Pusan Nat’l University 2; Department of Atmospheric Science, University of Alabama, Huntsville. Scan-Angle Method. Algorithm.

E N D
Evaluation of Tropospheric Ozone Derived from Scan Angle Geometry Method (SAM) Jae H. Kim1, Sunmi Na1, and Mike Newchurch2 1; Department of Atmospheric Science, Pusan Nat’l University 2; Department of Atmospheric Science, University of Alabama, Huntsville
Scan-Angle Method Algorithm Weighting function of Diff Tropospheric ozone scaling factor x Diff + 30DU (scaling factor = 6.7) Problem Diff can not directly apply to TOMS because measurements do not occurs simultaneous both at nadir and at high scan position.
Scan-Angle Method How to apply to TOMS • Orbital drift causes FOV at nadir position to overlap closely with the FOV at high scan position about two days later. • Select a box with 15 degree longitude and 2 degree latitude • Diff is sum of retrieval efficiency difference and stratospheric ozone • difference between two scan positions. • => this method can only applicable where daily stratospheric • ozone variation is relatively small and smooth => tropics.
Scan-Angle Method Improvement EP-only SAM ADEOS-EP SAM
SAM & Aerosol Index The correlation between diff & AI
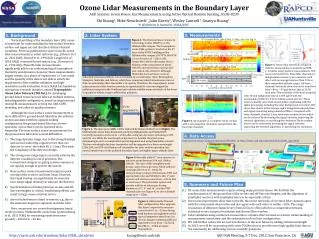
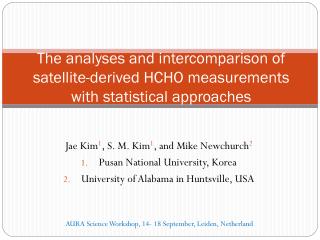
SAM GEOS-CHEM CCD Fire Counts Carbon Monoxide Comparison (Dec-Jan-Feb)
SAM GEOS-CHEM CCD Fire Counts Carbon Monoxide Comparison (Mar-Apr-May)
SAM GEOS-CHEM CCD Fire Counts Carbon Monoxide Comparison (Jun-Jul-Aug)
SAM GEOS-CHEM CCD Fire Counts Carbon Monoxide Comparison (Sep-Oct-Nov)
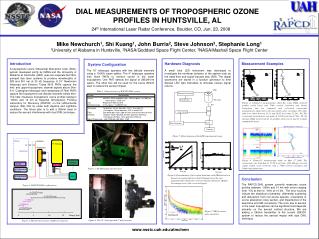
Comparison Abidjan (5ºN 4 º W)
Comparison Madras (13 º N 80 º E)
Comparison Bangkok (14 º N 101 º E)
Evaluation • The correlation between the SAM results and CO is higher for the December-February period corresponding to the northern burning season. • The correlation between the CCD results and CO is higher during the October-November period corresponding to the southern burning season. • The correlation between the SAM and CCD results shows a disagreement for December-February period, the northern burning season.
Conclusions • Tropospheric ozone signal can be detected by using TOMS error depending on scan angle geometery. • Number of data sampling give an improvement for ozone derivation from SAM => Multiangle Scanning Spectrometer may be able to provide tropospheric ozone derivation with a better temporal and spatial resolution. • The SAM observes the elevated ozone over northern equatorial Africa during the northern burning season (Dec-Feb), which is consistent with fire counts and CO measurements. However, the feature is not reported by the CCD results.On the contrary, the CCD shows elevated ozone always over southern Africa. • The seasonal variation of ozone distribution from SAM agrees well with those from MOZAIC and GEOS-CHEM at Abidjan, Madras, and Bangkok. However, not from CCD.