Download
1 / 1
10 likes | 154 Views
Vertical Ozone Profiles at TEXAQS 2000 Mohammed Ayoub 1 , Mike Newchurch 1 2 , Brian Vasel 3 Bryan Johnson 3 , Sam Oltmans 3 , Richard McNider 1 1. Department of Atmospheric Science, University of Alabama in Huntsville, USA 2. National Center for Atmospheric Research, Boulder, Colorado, USA

E N D
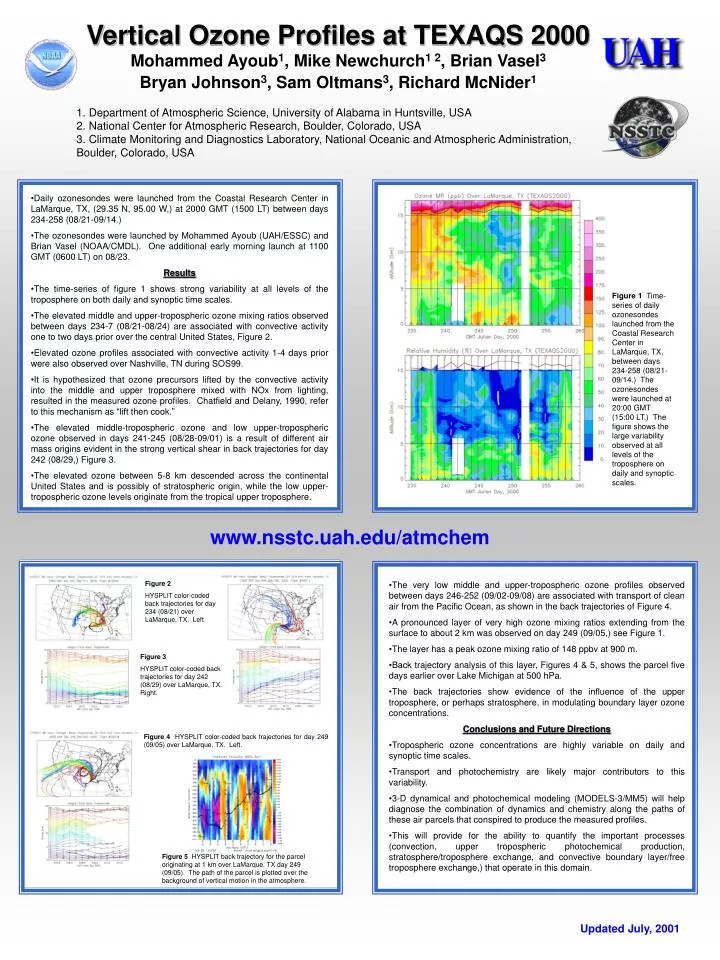
Vertical Ozone Profiles at TEXAQS 2000 Mohammed Ayoub1, Mike Newchurch1 2, Brian Vasel3 Bryan Johnson3, Sam Oltmans3, Richard McNider1 1. Department of Atmospheric Science, University of Alabama in Huntsville, USA 2. National Center for Atmospheric Research, Boulder, Colorado, USA 3. Climate Monitoring and Diagnostics Laboratory, National Oceanic and Atmospheric Administration, Boulder, Colorado, USA • Daily ozonesondes were launched from the Coastal Research Center in LaMarque, TX, (29.35 N, 95.00 W,) at 2000 GMT (1500 LT) between days 234-258 (08/21-09/14.) • The ozonesondes were launched by Mohammed Ayoub (UAH/ESSC) and Brian Vasel (NOAA/CMDL). One additional early morning launch at 1100 GMT (0600 LT) on 08/23. • Results • The time-series of figure 1 shows strong variability at all levels of the troposphere on both daily and synoptic time scales. • The elevated middle and upper-tropospheric ozone mixing ratios observed between days 234-7 (08/21-08/24) are associated with convective activity one to two days prior over the central United States, Figure 2. • Elevated ozone profiles associated with convective activity 1-4 days prior were also observed over Nashville, TN during SOS99. • It is hypothesized that ozone precursors lifted by the convective activity into the middle and upper troposphere mixed with NOx from lighting, resulted in the measured ozone profiles. Chatfield and Delany, 1990, refer to this mechanism as “lift then cook.” • The elevated middle-tropospheric ozone and low upper-tropospheric ozone observed in days 241-245 (08/28-09/01) is a result of different air mass origins evident in the strong vertical shear in back trajectories for day 242 (08/29,) Figure 3. • The elevated ozone between 5-8 km descended across the continental United States and is possibly of stratospheric origin, while the low upper-tropospheric ozone levels originate from the tropical upper troposphere. Figure 1 Time-series of daily ozonesondes launched from the Coastal Research Center in LaMarque, TX, between days 234-258 (08/21-09/14.) The ozonesondes were launched at 20:00 GMT (15:00 LT.) The figure shows the large variability observed at all levels of the troposphere on daily and synoptic scales. www.nsstc.uah.edu/atmchem Figure 2 HYSPLIT color-coded back trajectories for day 234 (08/21) over LaMarque, TX. Left • The very low middle and upper-tropospheric ozone profiles observed between days 246-252 (09/02-09/08) are associated with transport of clean air from the Pacific Ocean, as shown in the back trajectories of Figure 4. • A pronounced layer of very high ozone mixing ratios extending from the surface to about 2 km was observed on day 249 (09/05,) see Figure 1. • The layer has a peak ozone mixing ratio of 148 ppbv at 900 m. • Back trajectory analysis of this layer, Figures 4 & 5, shows the parcel five days earlier over Lake Michigan at 500 hPa. • The back trajectories show evidence of the influence of the upper troposphere, or perhaps stratosphere, in modulating boundary layer ozone concentrations. • Conclusions and Future Directions • Tropospheric ozone concentrations are highly variable on daily and synoptic time scales. • Transport and photochemistry are likely major contributors to this variability. • 3-D dynamical and photochemical modeling (MODELS-3/MM5) will help diagnose the combination of dynamics and chemistry along the paths of these air parcels that conspired to produce the measured profiles. • This will provide for the ability to quantify the important processes (convection, upper tropospheric photochemical production, stratosphere/troposphere exchange, and convective boundary layer/free troposphere exchange,) that operate in this domain. Figure 3 HYSPLIT color-coded back trajectories for day 242 (08/29) over LaMarque, TX. Right. Figure 4 HYSPLIT color-coded back trajectories for day 249 (09/05) over LaMarque, TX. Left. Figure 5 HYSPLIT back trajectory for the parcel originating at 1 km over LaMarque, TX day 249 (09/05). The path of the parcel is plotted over the background of vertical motion in the atmosphere. Updated July, 2001