Download
1 / 12
140 likes | 504 Views
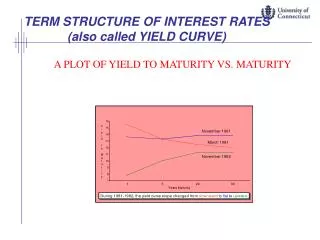
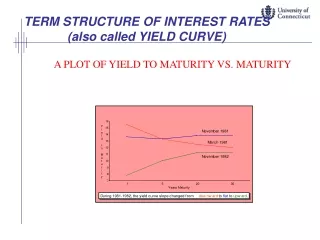
Term Structure of Interest Rates. The yield curve is a graph that displays therelationship between yield and maturity Information on expected future short term rates can be implied from yield curve Three major theories are proposed to explain the observed yield curve. Yields. Upward Sloping.

E N D
Term Structure of Interest Rates • The yield curve is a graph that displays therelationship between yield and maturity • Information on expected future short term rates can be implied from yield curve • Three major theories are proposed to explain the observed yield curve
Yields Upward Sloping Flat Downward Sloping Maturity Yield Curves
Today’s Yield Curve • 3-month T-Bill: 4.78% • 6-month T-Bill: 5.12% • 1-Yr T-Bill: 5.23% • 2-Yr T-Note: 5.63% • 5-Yr T-Note: 5.81% • 10-Yr T-Bond: 5.94% • 30-Yr T-Bond 6.07%
Forward Rates from Observed Long-Term Rates fn = one-year forward rate for period n yn = yield for a security with a maturity of n
Example of Forward Rates • 4 yr = 9.993 3yr = 9.660 fn = ? • (1.0993)4 = (1.0966)3 (1+fn) • (1.46373) / (1.31870) = (1+fn) • fn = .10998 or 11% • Note: this is expected rate that was used in the prior example
Downward Sloping Spot Yield Curve • Zero-Coupon RatesBond Maturity • 12% 1 • 11.75% 2 • 11.25% 3 • 10.00% 4 • 9.25% 5
Forward Rates for Downward Sloping Yield Curve 1-yr Forward Rates 1yr [(1.1175)2 / 1.12] - 1 = 0.115006 2yrs [(1.1125)3 / (1.1175)2] - 1 = 0.102567 3yrs [(1.1)4 / (1.1125)3] - 1 = 0.063336 4yrs [(1.0925)5 / (1.1)4] - 1 = 0.063008
Theories of Term Structure • Expectations • Liquidity Preference • Upward bias over expectations • Market Segmentation • Preferred Habitat
Expectations Theory • Observed long-term rate is a function of today’s short-term rate and expected future short-term rates • Long-term and short-term securities are perfect substitutes • Forward rates that are calculated from the yield on long-term securities are market consensus expected future short-term rates
Liquidity Premium Theory • Long-term bonds are more risky • Investors will demand a premium for the risk associated with long-term bonds • Yield curve has an upward bias built into the long-term rates because of the risk premium • Forward rates contain a liquidity premium and are not equal to expected future short-term rates
Liquidity Premiums and Yield Curves Yields Observed Yield Curve Forward Rates Liquidity Premium Maturity
Market Segmentation and Preferred Habitat • Short- and long-term bonds are traded in distinct markets • Trading in the distinct segments determines the various rates • Observed rates are not directly influenced by expectations • Preferred Habitat • Modification of market segmentation • Investors will switch out of preferred maturity segments if premiums are adequate