Download
1 / 45
460 likes | 627 Views
Economics of Biofuels. Lecture 17 Economics of Food Markets Alan Matthews. Why governments are interested in bioenergy?. Climate change – CO 2 abatement Energy security High energy dependence on politically unstable regions (Russian gas, Middle East)

E N D
Economics of Biofuels Lecture 17 Economics of Food Markets Alan Matthews
Why governments are interested in bioenergy? • Climate change – CO2 abatement • Energy security • High energy dependence on politically unstable regions (Russian gas, Middle East) • Rising price of fossil fuels; crude oil <$25/barrel in Sept 2003, now over $100/bl • Diversification of farm activities; rural development • …but concern over environmental impacts • Biofuel technology is land intensive
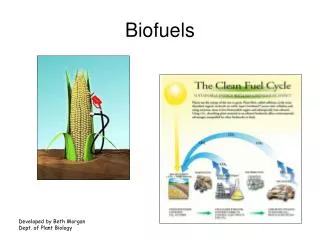
The EU perspective Source: Commission, Fact Sheet on Biofuels, 2006
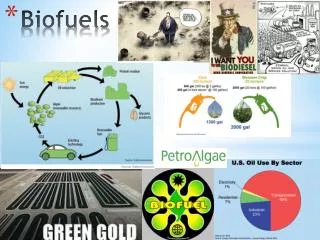
A US perspective Source: Franci, American Fram Bureau Federation, 2007
Main questions • What is economic viability of biofuel production? • What polices are in place to promote production and use of biofuels? • What will be effect of biofuels on agricultural land use and markets? • Are current biofuels policies sensible? • In terms of economic efficiency, climate change, world hunger, trade and the environment • What are challenges for the future?
Reading suggestions • Vast and growing literature • Commission documents • NGO and interest group documents • Impact on agricultural markets (Schmidhuber, OECD, IFPRI) • Surveys (Bamière et al., World Bank) • Reviews of policies (Global Subsidies Initiative, Commission annual progress reports)
Some definitions • Bioenergy is energy of biological origin, derived from biomass, such as fuelwood, livestock manure, municipal waste, energy crops • Biofuels are fuels produced from biomass, usually of agricultural origin • Bioethanol • Biodiesel • Biogas • Energy crops are crops specifically cultivated to provide bioenergy, mainly biofuels but also (miscanthus, short rotation coppice, eucalyptus) other forms of energy • In these lectures we concentrate on biofuel policies
Main bioenergy feedstocks • Wood • Forest management residues • Fuel timber • Crops • Annual (cereals, oilseed rape, sugarbeet) • Perennial (miscanthus, reed canary grass, short rotation coppice) • Wastes • Straw • Animal manure Source: Mortimer, 2007
Biofuel transformation processes First generation Second generation
Biofuel uses • Bioethanol • Used as neat ethanol (E95, blend of 95% ethanol and 5% water) • Used as E85 (85% volume ethanol with petrol) in flex-fuel vehicles • Used as blend smaller than 5% volume (E5) in ordinary petrol or as its derivative ETBE • Biodiesel • Current maximum 5% in diesel blends, otherwise can only be used in modified diesel engines • Current 5.75% EU target cannot be met with ordinary blends of petrol and diesel • Need for separate infrastructure (pumps, storage, delivery for E85 and biodiesel or pure plant oil)
Production and trade trends • Brazil (sugar) and the US (maize) are the leading producers of ethanol • EU (esp. Germany) is leading producer of biodiesel (rapeseed) although production in the US (soybean) is rising • Malaysia and Indonesia are increasing production of biodiesel from palm oil • Very limited trade in biofuels to date, mainly some Brazilian bioethanol to EU
Economics of biofuel production • The rise in oil prices is the most important factor boosting the competitiveness of alternative fuels, including biofuels. • future outlook for oil prices? • Feedstock costs are the most significant cost of biofuel production, up to 40-50% for US corn based ethanol, 80% for EU biodiesel from rapeseed. • Energy is also a major cost component, up to 20% of biofuel operating costs in some countries. • The sale of byproducts, such as dried distillers’ grains, also contributes to a biofuel plant’s profitability. • The ratio of crude oil prices to feedstock prices offers a simple indicator of the competitiveness of biofuel made from various feedstocks.
Economics of biofuel production • Past economics very influenced by subsidy contribution… • …but higher crude oil prices make competitive production more likely • Qualifications • Increased biofuel production as well as higher energy costs will push up feedstock costs • As production grows, the market contribution of by-products may diminish as outlets become satiated • The difficulties facing German biodiesel production in 2007 provide a cautionary example
Parity and break-even prices • Parity prices measure the crude oil or petrol price at which particular feedstocks become competitive for biofuel production • calculated for very specific production and conversion environments as well as feedstock prices • Sensitive to US dollar exchange rate • Schmidhuber’s parity prices are based on average feedstock prices from early 2000’s • May make more sense to think in terms of break-even prices for biofuel producers • Given crude oil price, how much can biofuel producers afford to pay for feedstock? • Comparing break-even price with current price for sugar, maize etc. indicates potential for further growth in biofuel production, but need to factor in risk and uncertainty discounts • Next slide shows how competitiveness of biodiesel varies with likely scale of biodiesel demand (and thus price of rapeseed feedstock)
Competitiveness of biodiesel under alternative scenarios S-1%, S-7% and S-9% represent targets for biofuel share of transport fuels Source: Bamière et al., 2007
Instruments for supporting biofuels • biofuel blending obligations (mandates) • excise duty exemptions • tariff protection • crop (feedstock) subsidies • R&D and investment supports • fuel standards
EU objectives for biofuels • 1997 • 12% renewable energy target by 2010 • 2003 Biofuels use directive • 2% target for biofuels in transport fuels by 2005 (1% achieved); 5.75% by 2010 • Not mandatory, but annual reports required • 2003 Energy taxation directive • Allowed MS to grant tax reductions and exemptions on biofuels • 2007 “Energy Policy for Europe” package • Mandatory target of 10% of biofuels in transport fuels by 2020
EU supports for biofuels • EU has authorised MS to grant tax relief on biofuels • Energy crop payment of €45/ha introduced in 2003, but limited to 2 million hectares on non setaside land • Energy crops can also be grown on setaside land • High tariffs on ethanol (up to 63% AVE) but with preferential access for many developing countries • Tariffs on biodiesel are low (6.5%) and even lower (0-5%) on oilseeds and vegetable oils for industrial uses • Relatively limited EU interventions has encouraged MS to implement their own action plans and instruments
Drivers of US demand for bioethanol • Oil price increases • Fuel tax incentive for ethanol blends • Sudden replacement of MTBE with ethanol in 2006 because of pollution worries • Renewable Fuels Standard – mandated use of 7.5 billion gallons ethanol • 2007 increase in RFS to 22 billion gallons by 2022, of which 15 billion to come from corn by 2012 • Tariff protection against cheaper imports
Current Irish policy • Excise tax relief on selected biofuel projects (cost €200m over 2006-2010 period) • VRT relief for flexible fuel vehicles • Announced move towards biofuels obligation from 2009, with targets of 5.75% for 2010 and 10% by 2010 – public consultation underway. • Energy crop premium of €80/ha (on top of EU premium of €45/ha) to incentivise supply of raw materials – cost €6 million 2007-09 period • Bioenergy Action Plan published March 2007 commits public bus companies to move to 5% diesel blends and new vehicle purchases must be capable of using higher blends • Other measures target biomass use for energy and heat Source: DCENR, National progress report on biofuels use, 2007
Subsidies to liquid biofuels Source: Global Subsidies Initiative, US Update, 2007
EU land constraints • EU biofuel directive: 5.75% of EU fuel supply by end 2010 • 24 mio t biofuels to reply about 18.6 mio t of fossil fuels (due to lower energy content) • European Commission estimates • 16-18 mio ha needed if all biofuels feedstocks grown in EU • Which is about 17% of total arable area: 103.6 mio ha • Area reserve: • About 2.8 mio ha obligatory set aside not yet grown with biofuel crops • 3 mio ha arable land currently not used. Source: Banse, 2007; see also Bamière et al. 2007
Impact on agricultural markets • How large will be potential demand from energy markets for agricultural products? Will it be large enough to reverse the secular decline in real food prices? • While large technical potential for biomass exists, food prices cannot rise faster than energy prices in the longer term (ceiling price effect)
Floor and ceiling price effects (Schmidhuber 2006) • Agricultural prices always affected by energy prices • Initially largely through higher input costs But as fossil fuel energy prices reach or exceed the energy equivalent of agricultural products, energy market creates demand for agricultural products • Higher energy prices now affecting output prices • OECD estimates show that the effect of oil prices on production costs is comparatively much stronger than that on increased demand for biofuel, but results are sensitive to oil price.
Floor and ceiling price effects (Schmidhuber 2006) • Given large (elastic) demand from energy market with competitive agricultural feedstocks, energy market creates a floor price for agricultural products • Fossil fuel prices also create a ceiling for competitive feedstocks whose price cannot rise faster than energy prices without pricing themselves out of the energy market • Floor and ceiling prices together create a price corridor for agricultural products • Market integration is not complete in practice due to logistical and technical problems • Apart from Brazilian cane-ethanol complex
Sugar prices track oil prices above US$35/barrel Source: Schmidhuber 2006
Differential price effects on agricultural markets • Food price increases will be neither open-ended nor uniform • Agricultural products will be affected differently depending on • Their break even or parity point • Balance of energy and protein content • Bioenergy demand is limited to the energy content of feedstocks, creating additional supply of protein-rich by-products • Protein prices are likely to rise less rapidly than energy prices and could even fall in absolute terms
Differential price effects of different bioenergy scenarios Source: Schmidhuber 2006
Agricultural market effects • With greater share of maize and other markets characterised by inelastic demand (e.g. through biofuel mandates) which is also tied to crude oil prices, together with smaller stocks, increased agricultural crop price and market volatility can be expected
Agricultural market effects • Various empirical studies • Commission, Impact assessment of 10% biofuels target • See review of studies in Rajagopal and Zilberman, 2007 • Specific results no longer very valuable because of low crude oil price assumptions
Food price effects • First round impact approximated by (change in price of raw ingredient) x (share of food item price represented by that ingredient) • Example (US data) • Maize is 38% of cost of producing pigmeat, and pigmeat is 28% of final retail price of pork • Suppose ethanol demand increases maize price by 50% • Price of pork would then increase by 5.3% • Overall, doubling of feed grain and oilseed prices would increase food prices by less than 4%