Download
1 / 34
340 likes | 404 Views
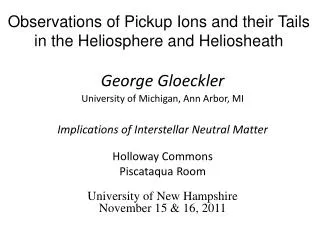
Plasma in the Heliosheath. John Richardson M.I.T. Collaborators: J. Belcher, J. Kasper, E. Stone, C. Wang. Outline. The termination shock Overview of the first year-plus of plasma data from the heliosheath V1 and V2 speed differences Flow angles and the TS shape

E N D
Plasma in the Heliosheath John Richardson M.I.T. Collaborators: J. Belcher, J. Kasper, E. Stone, C. Wang
Outline • The termination shock • Overview of the first year-plus of plasma data from the heliosheath • V1 and V2 speed differences • Flow angles and the TS shape • Comparisons of the HSH and magnetosheath plasmas and implications for TS variability • Summary
Apropos: Sticking Our Head Out Heliosphere: pressure balance between solar wind and local interstellar medium. Magnetized plasmas cannot mix. Boundary is the Heliopause Shocks form in both flows, plasma moves downstream. Solar wind is observed (IGY). Sticking our Head out E. Möbius UNH/SSC
Plasma Flow V1 (94 AU) 84 AU Belcher
Heliospheric Asymmetry. V1 enters TS foreshock region At 85 AU, V2 enters At 75 AU. Why? A LIC magnetic field at an angle to the flow can cause asymmetries. 84 AU 75 AU
Shape of the Termination Shock • TS is blunt, as evidenced by streaming of foreshock beams at V1 and V2 Sticking our Head out E. Möbius UNH/SSC
Simulation of sheath (Opher) Tilted LIC magnetic field gives asymmetry TS and HP closer in South than North. Magnitude of asymmetry was subject of controversy Large asymmetry implies large LIC B field. B
View from SUN:R is outward V1 N T V2
PLS SPECTRA • HS on DOY 261, 2007 • V(R,T,N) = 157, 59, -21 km/s • N = .0041 /cc • T = 240,000 K • Heating occurs at shock
Asymmetry Observed: V2 crosses the TS In Aug. 2007 at 84 AU • V2 TS Overview • Speed decrease starts 82 days, 0.7 AU before TS • Crossing clear in plasma data • Flow deflected as expected • Crossing was at 84 AU, 10 AU closer than at V1 • Speed decreases before shock
Total H+ energy (flow + thermal) • Discrete steps • AFTER increased B regions • Lose 40% of energy before TS • After TS, only 20% of energy in thermal plasma. • Need T(pu) of order 6-10 keV.
Structures of TS crossings a few hours apart are very different: there appear to be two ramps in first crossing.Shock may be reforming downstream(Burlaga et al.)
Shock jump comparison • Interplanetary shock (blue), • Neptune’s bow shock (black), • The TS (red) • Normalized to SW upstream of the TS
Comparison of Reflected Ions Termination shock ICME Jupiter Jupiter Saturn Uranus Neptune ICME TS NH/NC .34 .45 0 .48 0 - .5 0 TH/TC 6.3 7.5 0 13.0 0-10 0 T 5.1e6 4.8e6 2.6e6 3.6e6 1.8e5 Uranus has H corona - perhaps creates own pickup ions? Study of ICME sheaths may help understand this heating.
Daily Averages • |V| ~ 150 km/s • N - decreasing; from .002 to .0011 /cc (Avg = .0016 /cc) Decrease in SW flux? • T decreasing (Avg = 118,000 K)
Daily Averages • VR fluctuates |Vr| = 137 km/s • VT constant 51 km/s • VN periodic -17 km/s • Transient at 2008.62
V1 V2 Model (Pogorelov) 4 G, field in HDP, tilted 30o from ecliptic plane V1 VR > V2 VR V1 |VN| >V2 |VT| V2 V1 VT V1 -VN
LECP PLS Vr V1 and V2 radial speeds are different V1 LECP Speeds in the heliosheath (Decker et al.) V2 PLS speeds in the heliosheath -Vt
V1 - V2 comparison: Velocity V1 (LECP) V2 (PLS) VR VT VR VT VN 67±16 -42±15 138 48 -14 V V V -32º 20º -6º
If the TS normal is not parallel to the upstream solar wind, the solar wind is deflected at the TS. If shock deflection gives initial flow angle in HSH, then 1) For VT after TS of 25 km/s, TS angle = 10 in RT plane 2) To make average VN angle, need 5.5° angle in RN plane. Suggests TS more blunt in T than N directions N T
|V| • Periodicities in RN and TN planes • 110-day period • Averages: -6º,20º • Amplitudes: 8º (R-N plane), 17º (T-N plane) R-T angle R-N angle T-N
110-120 day period in VN, VR (Lomb-Scargill) • Power in VN, VR Vn
How to get oscillations? Change shock angle? (Deflection At TS depends on shock normal) Waves on shock? Change in TS shape? To make VN oscillation, need ±6º change in TS angle with a 110 day period.
Why 110 days? • If fast mode speed determined by pickup ions, then round trip wave time from TS to HP is ~ 110 days. • Changes in solar wind (heliospheric current sheet tilt, polar coronal hole boundaries, MIRs?)
TEMPERATURE DISTRIBUTIONS • SW - 10,000K • HSH - 100,000 K • HSH - numerous very low T spectra • Fluctuations (∆T/T) similar in SW and HSH, but likely a coincidence. • T(HSH) = 13 T(SW) • We look at HSH T distributions
Lots of scatter in T - caused by changes in TS motion? T depends on TS speed Using R-H relations, if TS speed varies ±100 km/s, T changes by a factor of 5 Good upper bound (inward motion 100 km/s) Lower bound not as good: faster outward motion or reforming shock Need very dynamic TS
Comparison of plasmas in magnetosheaths and the heliosheath HSH scales larger by factor of 1000 VR less variable In HSH Boundary motion less important in HSH Speeds determined by large-scale motions VR HSH VR (km/s) Jup Sat Ura Nep ICME TS 35 61 42 115 140 87 114 Jup
HSH Relative Standard Deviation of VR Jupiter Saturn Uranus Neptune TS V2 0.38 0.46 2.2 0.14 0.19 V10.58 0.35 Jup
185 DAY 186 2 1 0 Density variation also from small scale shock motion? Density Relative Standard Deviation of N Jupiter Saturn Uranus Neptune TS 0.62 0.41 0.41 0.13 0.52 0.43 0.67 N DEN similar in MSHs and HSH. Shock speeds similar?
√5 variation fits data Thermal speed w Place (w)/<w> HSH 0.41 V1 Jup 0.26 V2 Jup 0.22 V1 Sat 0.10 V2 Sat 0.14 W more variable in HSH than in MSH HSH V2 JUP MSH √5 variation too big