1 / 14

Edinburgh College Student Profile and Student Outcome charts

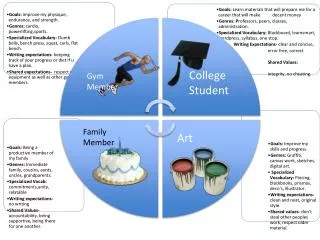
Edinburgh College Student Profile and Student Outcome charts. Quality Improvement Team – Granton Campus. Deprivation figures are based on the Scottish Index of Multiple Deprivation (SIMD) 2012.

wilmer
Download Presentation

Edinburgh College Student Profile and Student Outcome charts

An Image/Link below is provided (as is) to download presentation Download Policy: Content on the Website is provided to you AS IS for your information and personal use and may not be sold / licensed / shared on other websites without getting consent from its author. Content is provided to you AS IS for your information and personal use only. Download presentation by click this link. While downloading, if for some reason you are not able to download a presentation, the publisher may have deleted the file from their server. During download, if you can't get a presentation, the file might be deleted by the publisher.

E N D

Presentation Transcript


  1. Edinburgh College Student Profile and Student Outcome charts Quality Improvement Team – Granton Campus

  2. Deprivation figures are based on the Scottish Index of Multiple Deprivation (SIMD) 2012. *Only 12.2% of datazones in the Edinburgh local authority area fall within the lowest 20% in Scotland (equivalent figures for East Lothian and Midlothian are 5% and 7.1% respectively). **Only 7.1% of datazones in Edinburgh fall within the lowest 10% in Scotland (East Lothian and Midlothian figures are 0% and 1.8% respectively)

  3. College FE/HE split

  4. College FE/HE split

  5. College FE/HE split

  6. College FE/HE split

More Related