Download
1 / 17
170 likes | 266 Views
Brooklyn College 2004 Student Profile. Office of the AVP for Budget and Planning. Who are our students?. Degree Status. Undergraduates 11,172 73% Graduate Students 4,213 27% Fall 2004 Total 15,385 100% . Degree Seeking. Degree 14,401 94% Non-degree 984 6%

E N D
Brooklyn College 2004 Student Profile Office of the AVP for Budget and Planning
Degree Status • Undergraduates 11,172 73% • Graduate Students 4,213 27% Fall 2004 Total 15,385 100%
Degree Seeking • Degree 14,401 94% • Non-degree 984 6% Fall 2004 Total 15,385 100%
Full/Part Time Status • Full-time 8,352 54% • Part-time 7,033 46% Fall 2004 Total 15,385 100%
Gender • Men 5,751 37% • Women 9,634 63% Fall 2004 Total 15,385 100%
Age • 24 and younger 8,416 55% • 25 and older 6,969 45% Fall 2004 Total 15,385 100%
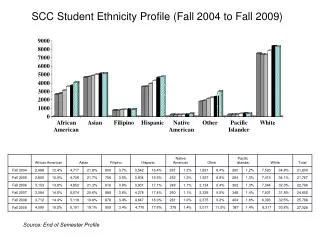
Ethnicity • American Indian/Alaska Native 21 >1% • Asian/Pacific Islander 1,381 9% • Black, non-Hispanic 3,446 22% • Hispanic 1,371 9% • White, non-Hispanic 5,168 34% • Other/Unreported 3,998 26% Fall 2004 Total 15,385 100%
131 Identified Countries (from Afghanistan to Yugoslavia) • 92 Languages(from Afrikaans to Yoruba)
Borough of Residence • Brooklyn 11,970 78% • Bronx 195 1% • Manhattan 660 4% • Queens 1,335 9% • Staten Island 379 2% • Other 846 5% Fall 2004 Total 15,385 100%
Household Income • Less than $10,000 16% • Less than $15,000 30% • Less than $20,000 36% • Less than $30,000 54% • Less than $40,000 64% • Less than $50,000 72%
Work Obligations • Do Not Work 38% • Work 1-20 hrs/wk 15% • Work > 20 hrs/wk 47%
Marital Status • Never Married 82% • Married 12% • Divorced 2% • Separated 1% • Widowed 1% • Other 2%
Parental Obligations • Supporting at least one child, any age 14% • Supporting at least one child, under 5 years old 3% • Supporting at least one child, 6 to 12 years old 9% • Supporting at least one child, 13 to 18 years old 5% • Single Parent 8%