Download
1 / 22
230 likes | 366 Views
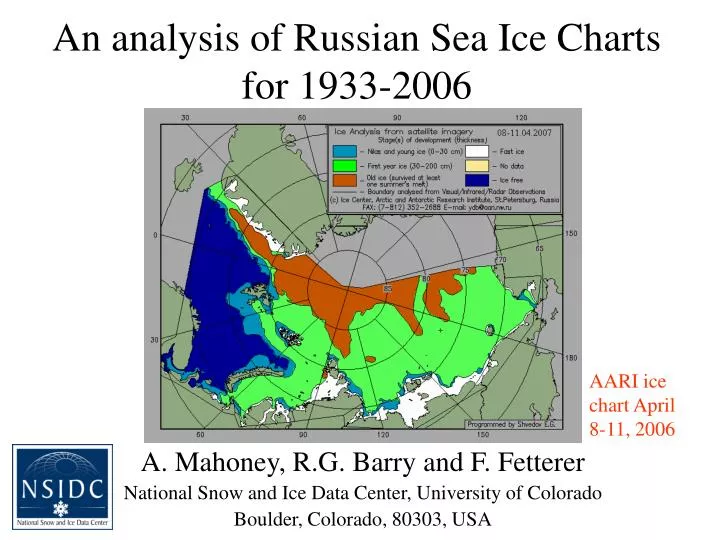
An analysis of Russian Sea Ice Charts for 1933-2006. AARI ice chart April 8-11, 2006. A. Mahoney, R.G. Barry and F. Fetterer National Snow and Ice Data Center, University of Colorado Boulder, Colorado, 80303, USA. Outline. Introduction Background on AARI ice charts Method

E N D
An analysis of Russian Sea Ice Charts for 1933-2006 AARI ice chart April 8-11, 2006 A. Mahoney, R.G. Barry and F. Fetterer National Snow and Ice Data Center, University of Colorado Boulder, Colorado, 80303, USA
Outline • Introduction • Background on AARI ice charts • Method • Locating discontinuous pack ice edges • Results • 20th Century sea ice extent variability • Comparison with other data • Meteorological data • Other ice charts • Summary and conclusions
About the AARI* ice charts *Arctic and Antarctic Research Institute St Petersburg, Russia • Operational sea ice charts generated approximately every 10 days, dating back as far as 1933 • Charts produced by assimilation of different observations: • satellite active / passive microwave • airborne radar and infrared • visual observations from aircraft, ships and coastal stations • coastal radar installations • buoy-mounted instrumentation • automatic ice stations • Provide information on: • sea ice concentration • stages of development • ice forms
Airborne radar flightlines • Standard pattern of airborne radar observations • Carried out periodically through the year since 1970s • Highest concentration along Northern Sea Route From: Remote Sensing of the Sea Ice in the Northern Sea Route, Studies and Applications, Johannessen et al, 2007
AARI ice charts in EASE grid • Ice charts are provided in SIGRID* format and converted to EASE-Grid** • Separate charts for eastern and western Russian Arctic • Spatial and temporal coverage is variable and discontinuous * Sea Ice Grid (World Meteorological Organization) **Equal Area Scalable Earth Grid – details at http://www.nsidc.org/ease
Examples of early AARI ice charts • Chart coverage is poor • Mostly limited to reconnaissance flights within range of coastal stations • Still possible to identify and locate the ice edge
Coast-to-pole vectors • 360 vectors along meridians from the coast to the pole • Used for locating the edge of the pack ice • Can cope with discontinuous edges
Locating the edge of the pack ice Ice edge is defined by either: • Transition to <15% ice concentration • Pack ice / landfast ice boundary • The coast Algorithm looks for ice edge along every coast-to-pole vector
Manual inspection of algorithm • Algorithm can be confused around islands and polynyas • In these cases, the edge is corrected manually • The edge on every chart will be manually inspected
Spatio-temporal coverage of results • Only spring and summer months charted in early years • Frequency of charts increases through record • Continuity of ice edges improves over time
Changes in sea ice extent • Much regional variability • Reduced autumn ice extent in early 20th century • Increasingly negative anomalies in both spring and autumn since 1970s • Missing data during key period (1993-1996) Manually inspected
Changes in sea ice concentration • Comparison of decadal monthly means • Increase from 1940s – 1970s is mostly matched by the loss between 1970s and 2000s
Temperature and pressure anomalies • Derived from station data North of 65°N • Early and late part of record warmer than middle • Evidence of decadal variability
Ice and temperature variability • No significant interannual correlation between ice and air temperature • Adjacent seas show similar temperature trends, but different trends in ice extent • Similarly weak relationship to station SLP observations • No consistent correlations with Arctic Oscillation index
Comparison with NIC* charts AARI > NIC NIC > AARI * National Ice Center • Overall mean difference is close to zero • AARI charts report higher concentration in autumn and winter • NIC charts report higher concentration in summer • No apparent long-term differences though number of common cells between chart sets increases with time
Summary • AARI ice charts provide a long timeseries of ice extent variability in Russian Arctic • Manual inspection of ice edges required throughout record • Ice edge results so far indicate: • Reduced ice extent in 1930s – 40s • greatest reduction in Barents Sea • Most evident in fall minimum extent • Greater reduction in ice extent since 1970s • Evident in both spring and autumn • Hi-latitude observations show cooling in mid 20th Century • No direct correlations with ice extent variability
Future work • Finish manual inspection of ice edges • More detailed analysis of sea ice variability • Both temporal and spatial • Include landfast sea ice • Statistical analysis of atmospheric forcing • Extend comparisons with other datasets • Derive an optimal, merged sea ice record from different charts
Acknowledgements • Vasily Smolyanitsky • Arctic and Antarctic Research Institute (AARI) • St. Petersburg, Russia • Providing the AARI data in SIGRID format with near-EASE-grid regridding software • Joey Comeaux • National Center for Atomspheric Research (NCAR) • Boulder, Colorado, USA • Assistance acquiring meteorological station data • NASA • Award NNG04GH03G, “Twentieth Century Sea Ice Conditions in the Eurasian Arctic from a Comprehensive Reconstitution and Synthesis of Russian Data Sources with Modern Satellite Data”