Download
1 / 22
220 likes | 415 Views
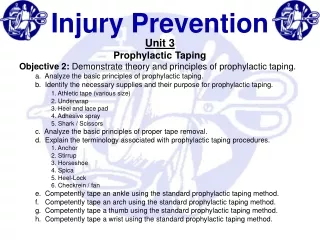
Injury Prevention Overview. WHAM. Extent of the injury problem Science of injury prevention Ways to help your patients and communities Resources. Injury Prevention Overview. Injuries are not “accidents”.

E N D
Extent of the injury problem Science of injury prevention Ways to help your patients and communities Resources Injury Prevention Overview
Injuries are not “accidents” • Unintentional injuries are the leading cause of death and hospitalization from ages 1 through 44 • Most are preventable • Known, effective interventions work! 10 Leading Causes of Death by Age --Blue boxes indicate injury deaths.
Quick Quiz… What are the leading cause of most fatal unintentional injuries?
Motor Vehicle Falls (adults) Poisoning (adults) Drowning (toddlers/teens/older adults) Airway Obstruction (under 1 y.o.) Pedestrian (older adults, ages 1-4 and 20-24) Pedal Cyclist Fires and Burns Poisoning Firearms Fatalities Source: Washington State Dept. of Health
Fatalities: tip of the iceberg 1 Death 45 Hospitalizations 1,300 Emergency Room Visits 2,600 Treated at Doctor Office or Home
Quick Quiz… What causes the most nonfatal unintentional injuries?
Falls (older adults) Motor Vehicle Poisoning (adults and toddlers) Natural environment (bites, stings, etc.) “Struck By/Against” Fires/Burns Cut/Pierce Non-fatal Hospitalizations Source: Washington State Dept. of Health
US Incidence and Costs of Injury (Finkelstein, et al 2006) ProductivityLosses Incidence Total Costs Medical Costs Fatal $143 Billion 149,075 $1 Billion $142 Billion Hospitalized $92 Billion 1,869,857 $34 Billion $49 Billion Non-hospitalized $171 Billion 48,108,166 $45 Billion $125 Billion Total $406 Billion 50,127,098 $80 Billion $326 Billion Cost Estimates Based on 2000 data
Injury Prevention as a Science • Known risk factors • Scientific research (conducted by leaders such as Johns Hopkins, Centers For Disease Control, Harborview Injury Prevention & Research Center, etc.) • Best practice interventions based on research and data
Scientific “public health” model: • Define problem: look at data! • Identify risk and protective factors • Develop and test prevention strategies • Assure widespread adoption of injury prevention principals and strategies
Quick Quiz Who is most likely to be injured?
Most at-risk • Younger children • Older adults • Males • Minority children • Poor children
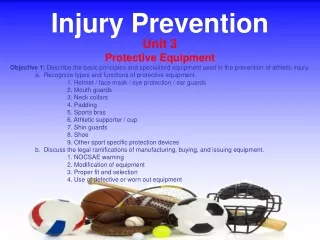
Traditional “E’s” of Injury Prevention • Education: community and individual • Engineering: safer products, roadways, construction practices, etc. • Enforcement: laws, policies,ordinances, building codes, etc.
Another “E”: Evaluation Activity should be based on data that shows a) issue is important b) target population is appropriate c) intervention strategy is promising
Trusted Resources • Centers For Disease and Prevention • Safe Kids Worldwide • American Academy of Pediatrics • Consumer Product Safety Commission • National Highway Transportation Administration (NHTSA)
Local coalitions • Safe Kids Pierce County • Pierce County Child Passenger Safety Team • Pierce County Falls Prevention Coalition • Pierce County Leadership for Alcohol and Drug Free Youth
New resource developed for emergency personnel: • Developed by local prevention specialists • Modules added to OTEP • Enables you to address prevention during the “teachable moment” following an injury or near-injury • Provides you with resources to leave with the patient/patient’s family WHAM
Why talk about injury prevention after an injury (or near miss)? On-scene EMS crews are in an ideal position to deliver prevention info because… • Research with brief interventions in hospitals show a patient is psychologically open to information, creating a “teachable moment” • EMS may be the "tipping point" for the patient or caregiver to incorporate safety practices • If a person experiences one injury, he/she is at higher risk for a future injury • Other healthcare providers often lack appropriate knowledge or resources • Patients treat on-scene and released may not have another opportunity for safety counseling
WHAM • What risks are observed on scene? • How can we keep from coming back? • Action to take to prevent future injuries • Materials to leave behind
WHAM Folders • Folders provided for emergency rigs • Folders divided by injury areas: • Helmets • Firearms • Poisoning • Falls among Older Adults • Child Passenger / Motor Vehicle Safety • Airway Obstructions • Burns • Open Water Drowning • Contains prevention info and local resources
WHAM developed by:Central Pierce Fire & RescueCity of DuPont Fire DepartmentGig Harbor Fire & Medic OneSafe Kids Pierce CountyTacoma-Pierce County Health Dept. With funding from:West Region EMS & Trauma Care Council