Download
1 / 28
300 likes | 508 Views
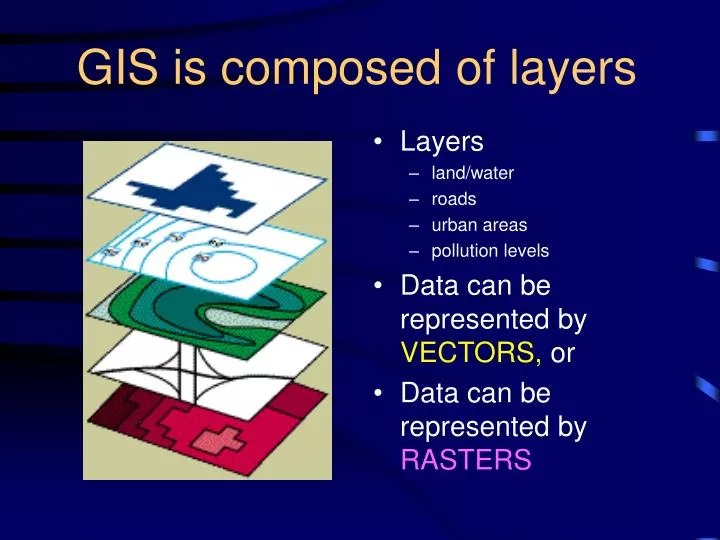
GIS is composed of layers. Layers land/water roads urban areas pollution levels Data can be represented by VECTORS, or Data can be represented by RASTERS. Vector and Raster Data Models. Vector Data Model. Discrete Boundaries are well defined (x,y coordinates)

E N D
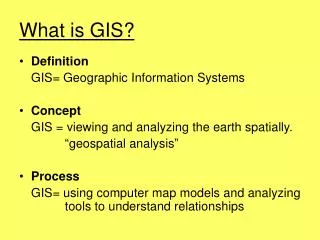
GIS is composed of layers • Layers • land/water • roads • urban areas • pollution levels • Data can be represented by VECTORS, or • Data can be represented by RASTERS
Vector Data Model • Discrete • Boundaries are well defined (x,y coordinates) • Geographic features are represented as: • Points • Lines • Polygons Every object is given a location
Types of Vector Data Models • Georelational (e.g. shapefiles) • Spatial and attribute stored separately • “geo” – graphic/spatial part • “relational” – database part (tabular) • Classical approach to vector data • Object-based (oriented) (e.g. geodatabase) • Spatial and tabular component are stored as a single system • Spatial features can have properties and methods • Recent trend towards object-based model
Vector Data File Types • Shapefiles – georelational • Coverage – georelational • Geodatabase – object-based (oriented) • DXFDigital Exchange Format (Autocad) ASCII w/binary code maintains layers • DLG Digital Line Graph - USGS (1:100,000 & 1:24,000) ASCII
Maps as numbers • Binary 0000 1111 • Eight bits in a row are termed a byte • 256 combinations or 0 to 255 • ASCII text- American Standard Code for Information Interchange - 256 standard meanings for the values that fall into one byte. (letters, numbers, special characters) • http://www.asciitable.com/
Shapefiles (~1990) • Most common vector data format • Openly published files specs – non proprietary • Simple file structure • 3 main files with same name but different 3 letter extension • LocalStreets.shp LocalStreets.dbf LocalStreets.shx • Attribute data stored in a dBase file (.dbf) • Geometry and location data stored in the .shp file • The .shx provides the “glue” • Does not support true topology
Topology – Spatial Relationships • Study of geometric properties that do not change when forms are bent, stretched, etc… • Knowledge about relative spatial positioning of features • How are features connected and which features are adjacent to each other • Directed lines are called arcs (have length and direction) • Points where arcs meet or intersect are called nodes node node arc
Raster Data Model • The world is composed of cells/pixels arranged in a grid • Each cell/pixel is assigned a numeric value • Integer – (no decimal) • Floating-point (decimal) (However data may be represented by codes) • The size of the cell/pixel determines the resolution Every location given an object
Creating A Raster • Overlay grid on real world • give each cell a value
Cell Values • Assume only one value per cell in any given layer • How do you decide what value to give the cell? • Value of greatest proportion? • Value of the most important feature? • Some systems allow for percent composition, edge effect
Characteristics of a Raster • Resolution • smallest unit discernible • often grid size, but not always • Orientation • angle that grid makes with true north • Value • information stored in cell
Characteristics of a Raster • Zones • areas of continuous values • e.g. county, land parcels, etc. • Class - term used to describe all the zones of same value in a layer • e.g. state parks
Characteristics of a Raster • Location • each cell has a unique location • often defined by bottom left corner • X, Y coordinate
Raster Data Structure and Compression • Lossless – no information is lost • Lossy – information is degraded • How is the raster data stored? • Cell-by-cell Encoding - data not compressed • Run-Length Encoding – data compressed • Quad Tree – data compressed • Wavelet – data compressed (lossy)
Storing the Information • Full length encoding • store every single cell’s value individually
Storing the Information • Run Length encoding • compress data
Storing the Information • Quadtree Encoding – compress data e.g. 0 and 2 are homogenous And 1 and 3 are broken down further
Types of Raster Data • Remotely Sensed Images • Satellite • Landsat (http://landsat.usgs.gov/) • AVHRR (http://edc.usgs.gov/products/satellite/avhrr.html) • SPOT (http://www.spot.com/) • Digital Elevation Models (DEMs) • U.S. Geologic Survey (USGS) DEMs • LIDAR (light detection and ranging) • Multibeam sonar (acoustics for capturing depth information) • Digital Orthophotos
Types of Raster Data – Images • Digital Raster Graphics (DRGs) • Scanned USGS topographic maps (http://topomaps.usgs.gov/drg/) • Graphic Image Files – historic aerial photos, scanned paper maps • .tif (Tagged Image File Format) • sid (LizardTech MrSID) • .img (ERDAS Imagine) • .jpg (Joint Photographic Experts Group). Associated world file provides geo- reference. • Many packages work on RECTIFYING these images • photograph’s scale is not constant across image
Raster Data Formats • ESRI Grids • Proprietary format • Discrete – integer (whole number) • Continuous – floating point (number with decimals)
Raster and Vector Summary • Vectors have advantage of accuracy but not good with continuous fields • Vectors were used first - digitizing • Earliest include ASCII (x,y coordinates but got too large) then binary took over. • Raster not good with lines or points but good with continuous coverage areas. • Raster has the mixed pixel problem.
Raster Advantages: • Simple data structure • Compatible with remotely sensed or scanned data • Simpler spatial analysis procedures • Raster Disadvantages: • Requires greater storage space on computer • Depending on pixel size, graphical output may be less pleasing • Projection transformations are more difficult (and can be time consuming) • More difficult to represent topological relationships • Positional precision set by cell size
Vector Advantages • Requires less disk storage space • Topological relationships are readily maintained • Graphical output more closely resembles hand-drawn maps • Preferred for network analysis • Vector Disadvantages • More complex data structure • Not as compatible with remotely sensed data • Software and hardware are often more expensive • Some spatial analysis procedures may be more difficult • Overlaying multiple vector maps is often time consuming
Triangulated Irregular NetworksTIN • A data model commonly used to represent terrain heights. • TIN forms a connected network of triangles • It is not a raster or vector format