Download
1 / 17
170 likes | 191 Views
A. B. Spatially congruent. Spatially incongruent. RF A. RF A. A R10 V. A R20 V. A R30 V. A R40 V. A. V. V. RF V. RF V. Asynchrony. Spatial separation. U nimodal. A R30 V. A R10 V. A R20 V. V 200 A. A R40 V. A 200 V. A. AV 0. V. s trong stimuli. MI=-57%. MI=-43%.

E N D
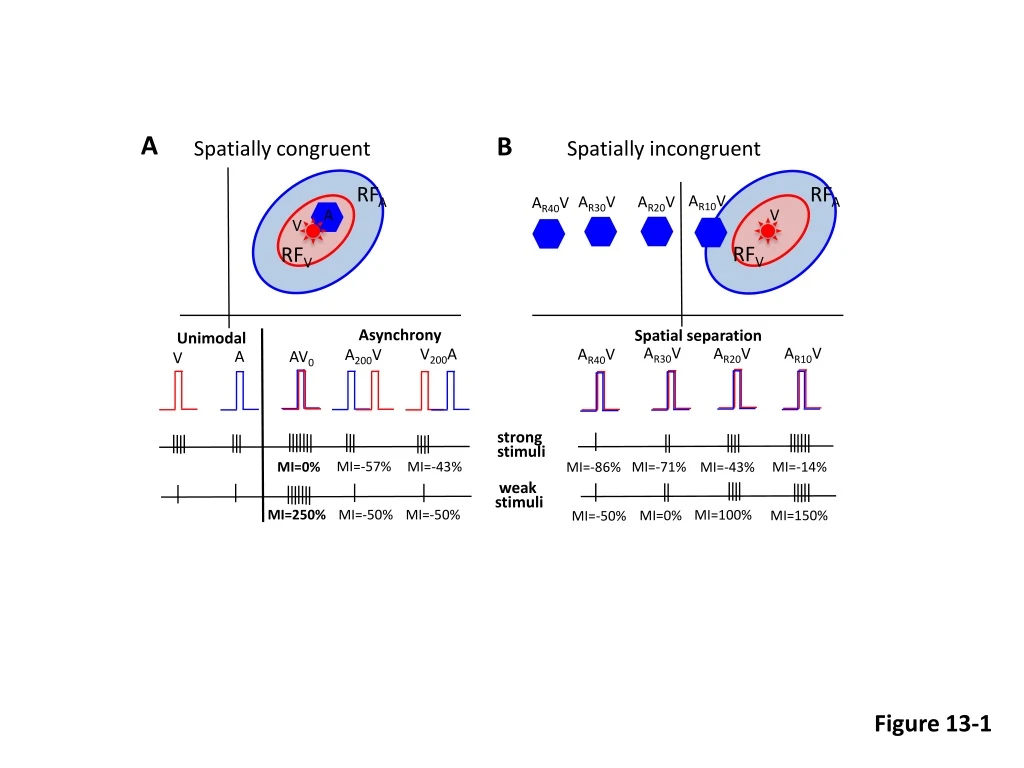
A B Spatially congruent Spatially incongruent RFA RFA AR10V AR20V AR30V AR40V A V V RFV RFV Asynchrony Spatial separation Unimodal AR30V AR10V AR20V V200A AR40V A200V A AV0 V strong stimuli MI=-57% MI=-43% MI=-71% MI=-14% MI=0% MI=-86% MI=-43% weak stimuli MI=250% MI=-50% MI=-50% MI=100% MI=0% MI=150% MI=-50% Figure 13-1
V rostral rostral up up 2 2 5 5 V 10 10 A 20 30 20 A’ 30 down 0 down 40 -30 40 0 -60 -30 caudal -60 caudal A B E/H unaligned, 2 objects A+V E/H unaligned, 1 AV object A’ A SC motor map E E H H AV A V -20 -20 0 V 0 V 20 20 oculo oculo A A’ cranio cranio A’ A’ oculo oculo Figure 13-2
B A First-saccade visual responses with and without a cluttered background ΔRT Absolute Error (deg) Saccadic Reaction Time (ms) VNB V Figure 13-3
B A Sound-localization responses in a noisy background Absolute Error (deg) 1. .8 Gain .4 Elevation ANB .2 A6 SNR (dB) A12 A18 Saccadic Reaction Time (ms) A21 Figure 13-4
#Responses 0 0 0 400 200 Reaction Time (ms) Auditory System Sound Spatial-Temporal Integration ‘OR’ SRT ΔSRT ΔSRT Light Visual System ‘RACE’ ΔT ΔR Stage 1 Stage 2 Figure 13-5
VIS A ‘HOW’ Visual input ‘WHERE’ V AV PSG PULSE FRate Nspk (prelude) Acoustic input AUD ON OPN OFF Nspk (burst) ‘WHEN’ FRate prelude burst ON OFF Figure 13-6
p(Y∩X) P(X∩Y) p(Y|X) = P(X|Y) = p(X) P(Y) Y Y∩X X∩Y X Figure 13-7
C A σB=2o σB=16o CLICK σB=32o Fraction Left -20 -10 0 10 20 Probe Displacement (degs) B Bimodal Visual only Auditory only MLE AV prediction AV measurement Equality Point (degs) Averages Figure 13-9
A B Subject PH Acoustic Elevation (deg) Power (dB) Probability Density Psychophysical Frequency (kHz) Frequency (kHz) Elevation (deg) Figure 13-10
A B 40 100 20 V-only A-only Vertical eye position (deg) 0 Success rate (percent) AV 50 -20 -40 0 -40 -20 0 20 40 0 0.5 1.0 1.5 Horizontal eye position (deg) Time since target onset (s) Figure 13-11
B A 20 2.0 15 1.5 Absolute Error (deg) Normalized Error re. V-only 10 1.0 5 0 0.5 200 400 600 0.4 0.6 0.8 1.0 Saccade Reaction Time (ms) Normalized Reaction Time re. V-only Figure 13-12
A C B Spatial disparities A1275V ΔΦ=0O A1275V ΔΦ=90O 40 20 Sensory Index Vertical (deg) 0 -20 -40 -40 -20 0 20 40 100 200 300 400 100 200 300 400 Saccade Reaction Time (ms) Horizontal (deg) Figure 13-13
A1275V V75A12 V 50 40 30 Perceptual Disparity (deg) Sensory Index 20 10 A 100 200 300 400 100 200 300 400 Saccade Reaction Time (ms) Figure 13-14
C Mean ΔSRT (ms) Figure 13-15
A B 1 ZW 0.8 ZH ZH 0.6 Fraction Rightward Answers 0.4 0.2 0 -60 -40 -20 0 20 40 60 Sound Location (deg) Figure 13-16