Download
1 / 20
210 likes | 330 Views
Anisotropy in Cosmic Ray Arrival Directions Using IceCube and IceTop. Frank McNally ISCRA. IceCube and IceTop. IceCube Rate: ~ 2 kHz Energy Range: ~100 GeV – 1 PeV Data in Data Storage and Transfer (DST) format contains limited information IceTop Rate: ~ 20 Hz

E N D
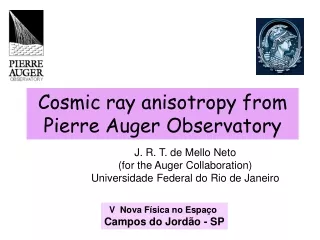
Anisotropy in Cosmic Ray Arrival Directions Using IceCube and IceTop Frank McNally ISCRA
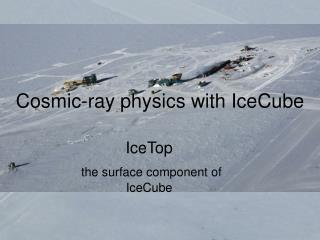
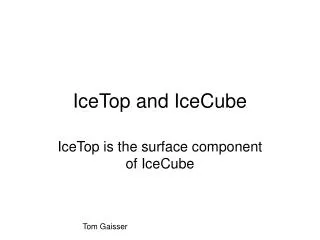
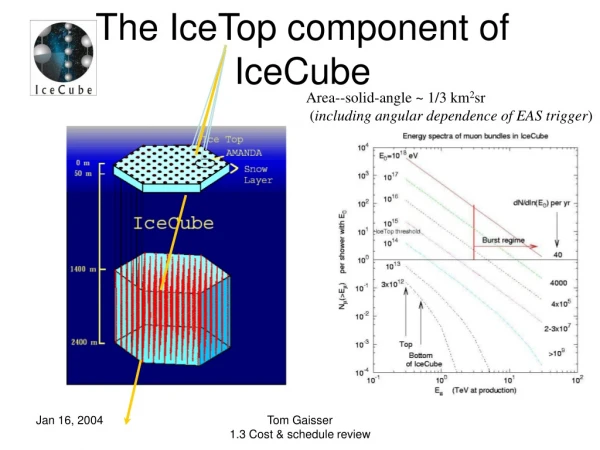
IceCube and IceTop • IceCube • Rate: ~ 2 kHz • Energy Range: ~100 GeV – 1 PeV • Data in Data Storage and Transfer (DST) format contains limited information • IceTop • Rate: ~ 20 Hz • Energy Range: ~100 TeV – 1EeV • More information per event
Anisotropy in IceCube (Published) • Median Energy: ~20 TeV • IC59 Relative Intensity Map IC59 Dipole & Quadropole Fit Residuals (20o smoothing) Abbasi et al., ApJ, 740, 16, 2011 arxiv/1105.2326
Anisotropy in IceCube (Preliminary) 4 years of data (IC59 – IC86-II) 1.24 x 10¹¹ events • Median Energy: ~20 TeV Relative Intensity Dipole & Quadropole Fit Residuals (5o smoothing) IceCube Preliminary
Anisotropy in IceTop • Median energy: ~400 TeV • Median energy:~2 PeV IceTop Published Aartsen et al., ApJ 765, 55, 2013 arxiv/1210.5278 IT59 + IT73 + IT81 IceTop Preliminary High energy IT59 + IT73 + IT81+ IT81-II
Taking the Next Step • Goal • Study anisotropy as a function of energy and composition • New energy estimator • Use additional information provided by IceTop for more accurate energy and composition reconstruction
Likelihood-based Energy Reconstruction – Building the tables • Using simulation, create histograms that store: • Primary information • Composition, energy, zenith, and distances from tanks to shower core • Observables • Charge registered at each tank • Environment • Snow depth at each tank • Bin all information • 110 Energy Bins, 4 Zenith Bins, 4 Snow Bins, 70 Distance Bins, 46 Charge Bins • Normalize histograms,so a bin [C, E, Z, Q, S, D] gives the probability that… • …a particle with: • composition C, • energy E, and • zenith angle Z • deposited a charge Q • at a tank with snow depth S • at a distance D from the shower core
Reconstruction • Iterative grid search tests core positions across array • Returns best core position, energy, and corresponding likelihood for each composition Example of likelihood space for a fine grid search
Performance Core_reco - Core_true (m) Log10(E_reco / E_true (GeV))
Energy Split Example (IT73+IT81):Split by NStations Relative Intensity Plots 7 stations 3 stations 9.69x10⁷ 2.17x10⁷ 8 - 9 stations 4 stations 6.54x10⁷ 2.47x10⁷ 10 - 14 stations 5 stations 4.74x10⁷ 1.72x10⁷ 6 stations 3.22x10⁷ 6.05x10⁶ 15 + stations
Summary & Moving Forward • Large Scale • Anisotropy appears to change as a function of energy • Small scale • Significant structure visible at 5o scale with IceCube data • Future Goals • More data now available: • IT81-III / IC86-III • New energy estimation • Use likelihood-based energy reconstruction to look at anisotropy as a function of energy and potentially composition