Download
1 / 19
190 likes | 199 Views
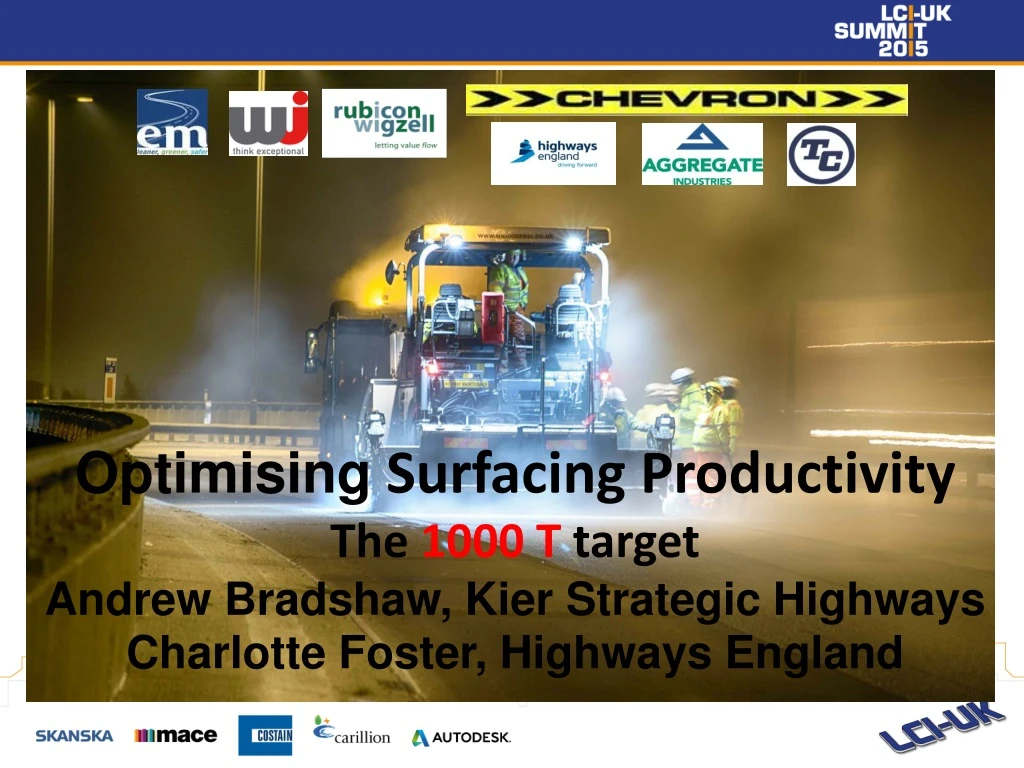
Optimising Surfacing Productivity The 1000 T target Andrew Bradshaw, Kier Strategic Highways Charlotte Foster, Highways England. D. M. A. I. C. T. Problem Statements. Problem Statement:

E N D
Optimising Surfacing Productivity The 1000 T target Andrew Bradshaw, Kier Strategic Highways Charlotte Foster, Highways England
D M A I C T Problem Statements • Problem Statement: • Highways England (HE) has the following challenges: Deliver large quantities of re-surfacing works across the network • Maintaining 97% lane availability at any point in time. • Increasing customer satisfaction • Creating 20% efficiency savings • The current rate of resurfacing for one standard shift with one gang of operatives has shown to be on average 240 tonnes per night. To meet the above targets there is a need to increase the productivity rates.
D M A I C T Project Methodology Define • Select the opportunity • Project planning • What does customer want? Measure • Map the process • How much does it cost? • Ask the team Analyse • Where is the value and waste? • What are the root causes? • What are the costs of waste?
D M A I C T Project Methodology Control • Implement actions • Rewrite procedures • Train Staff • Measure impact – visual methods • Manage change Transfer Take learning to other relevant areas Improve • What are the possible solutions? • Which ones have the greatest impact? • Which ones are the easiest to implement? • Will they work
D M A I C T Project Outline (Quad of Aims) Purpose Stakeholders & Benefits Deliverables Measures of Success
D M A I C T Project Outline (Quad of Aims) Purpose: • To optimise the surfacing outputs per shift and establish conditions for future schemes to enable a permanent increase in resurfacing productivity. • A specific objective for the project is to ultimately enable the laying of 1000 Tonnes of blacktop with one gang within one shift. • The project should include the challenging of the current working window times and identifying, challenging and ultimately removing constraints to enable the above targets.
D M A I C T Project Outline (Quad of Aims) Stakeholders and Benefits: • Road Users – cost reduction (economy of scale), reduced duration of road works and fewer closures • HA/ Service Provider – Less complaints received for long running road works • EMH and other collaboration partners – Increased profitability • Improved quality – fewer transverse joints
D M A I C T Project Outline (Quad of Aims) Deliverables: • Process map for improved process and guidance on how to implement. • Guidance on how to identify suitable conditions. • Table/calculation clarifying possible level of surfacing relating to specific working window times • Knowledge transfer pack / report to support sharing the learning and continuous improvement.
D M A I C T Project Outline (Quad of Aims) Success Criteria: • 1000 tonne resurfacing done in one shift with one gang • Increased repeated rate of surfacing per shift per gang compared to current rate (where 1000 Tonne is not achievable) • Reduced unit rates • Reduced amount of road works on the network compared to if this project had not taken place • Implementation as Business As Usual
D D M M A A I I C C T T Current state – What were the issues Issue – Why do we only pave for 33% of the available working time? – Can we increase this? 22.08 Access working area for surfacing 1 Planing 22.37 – 00.54 298 T Laid 2Hrs 11 Mins paved Cleaning and preparation 2 Paving 00.17 – 02.28 Material Call Off Curing 1 hour + Rolling 4 4 Remove TM 4.15-4.39 White Lining -3.00 3 07.00 02.00 22.00 23.00 00.00 01.00 03.00 04.00 05.00 06.00 Shift Time Working Time [hrs] Paving Time [hrs] Theoretical Working Window [hrs] Top critical areas of Non Value Added 1. Why does it take nearly half an hour from close of motorway to start planing ? 2. Paver idle – Awaiting material – Why are we waiting ? 3. Off site nearly 1.5 hours before we need to be – can we extend paving further and get off later? 4. Are the working windows in line with contractually acceptable delay times – can they be increased?
D M A I C T The outcome – 1024 T ! Original work - Paver active for 33% of working time 1000 T work – Paver active for 64% of working time 21.03 Access working area for surfacing Planing 21.30- 02.45 Cleaning and preparation Material Call Off Paving 22.15 – 05.05 Curing 1 hour + Rolling – 05.25 White Lining 02.30 - 06.46 Remove TM – 07.39 20.00 00.00 02.00 04.00 06.00 22.00 08.00 Paving Time [hrs] Working Time [hrs] Shift Time / Working Window [hrs] Data: Statistics (@ 45 mm thin surfacing): 10 Hours 13 Hours 10 Hr 36 Mins 1024 T 6 Hr 50 Mins Shift Duration (staggered): Theoretical Working Window 20.00-09.00: Actual Work (TM on – TM off) 21.03-07.39: Tonnage laid: Paving duration 22.15-05.05: 149 T 2700 m 64% Average hourly tonnage laid: Total meters laid: Paving time of full working time - 6 Hr 50 Mins out of 10 Hrs 36 Mins
D M A I C T Non-Paving but essential time within each shift Set-Up & De-mob Constraints times: Fixed time required before and after planing on ALL schemes (type A) Constraints – constant at this type of work irrespective of the working window: Before paving: Finalising TM 15 minutes Mobilisation of planer: 30 minutes Planing head start: 45 minutes After paving: Rolling: 30 minutes Cooling: 75 minutes TM Removal: 30 minutes Total Necessary Non-paving time: 3 Hrs 45 Mins Standard for ALL future works Up front prior to paving start 1 Hr 30 Mins Standard for ALL future works Post paving before road opens 2 Hr 15 Mins
D M A I C T New theoretical laying capability in any (type A) shift 1 Hr 30 Minutes: Pre-constraints (TM / Mobilising / Planing head-start) 2 Hr 15 Minutes: Post-constraints (Rolling / Curing / TM removal) Start up Paving Finish Paving Time [Y Hours] Working Window – X Hours Theoretical Paving Calculation: Working Window duration X Hours Less Start up / Finishing fixed times 3 Hr 45 Minutes = Theoretical working window: Y Hours Expected laying rate 130 Tonnes / Hour Theoretical possible blacktop output: Y Hours x 130 Tonnes / Hour
D M A I C T Theoretical laying capability in 8 hr shift Original Paver Utilisation (8 hour shift - based on actual Working Window): 33% New Theoretical Paver Utilisation (8 hour shift – based on full working window utilisation): 53% Finalise TM 22.00 – 22.15 Mobilising plant 22.15 – 22.45 Planing 22.45 – 03.00 Cleaning and preparation Material Call Off at 21.00 Paving 23.30 – 3.45 Curing 4.15-5.30 Remove TM 5.30 – 6.00 Rolling – finish 4.15 White Lining – 4.30 02.00 22.00 23.00 00.00 01.00 03.00 04.00 05.00 06.00 Shift Time [hrs] Fixed pre-paving time 1Hr 30 Mins Fixed post-paving time 2 Hr 15 Mins Paving Time 4 Hrs 15 Mins (Theoretical in 8 Hrs) Analysis: Original paving output – 2 Hrs 11 Mins (@ 137T per Hour) = 298T Paving rate average (from analysis of 6 months data) 130T per Hour (approximately = planing rate) New theoretical paving time 23.30 – 03.45: 4 Hr 15 Mins New theoretical output 130T per Hour x 4 Hrs 15 Mins = 552T
D M A I C T Amount of blacktop laid per shift. Average laid per night on M5 J6-9 SB (Phase 2) works: 404 Tonnes per gang per night Base line Avg: 240 Tonnes per gang per night SB Uplift to Base Line: 68% Nights of site visit: 300 Tonnes per gang per night SB Uplift to night visit: 35% NB (Phase 1) Avg: 344 Tonnes per gang per night SB Uplift to NB: 17%
D M A I C T Benefits
D M A I C T Area 7 Resurfacing Efficiency Work 20.50 Road Closed 05.04-05.20 1 1 7 Milling 1 21.19- Milling 1 1 Milling 2 21.25- 1 1 Milling 3 21.30-0043 Cleaning and preparation 3 Paving 22.43-01.17 2 Paving 2 Paving 00.38-02.55 6 Rolling Curing 1 hour + White Lining 4 06.00 20.00 00.00 02.00 04.00 22.00 5 5 Paving Time [hrs] Working Time [hrs] Working Window [hrs]
D M A I C T Area 7 Resurfacing Efficiency Work Increase in output from Eastbound to Westbound: 20% per shift EB Outputs significantly reduced in 7 out of 48 shifts due to plant breakdown (15%)
D M A I C T Asset Mngt Donna James Jason Glasson James Burdall Build Andy Rowley Charlotte Foster Darren Checksfield Best Design Donna James Jason Glasson James Burdall Collaborate & Contract Shah Ahmed Jon Cole Longer scheme lengths Supply Chain involvement Collaborative Planning Package with MP schemes Develop contingency sites for winter to avoid lost shifts Ultra thin /thin in summer, deeper inlays winter Roll out Pavement Optimisation Possessions Lean optimise working windows Lean logistics-quarry map, supply constraints Develop Industry Engagement Plan (inc Engagement Council work) Develop supervisor / operative skills Optimise source of supply Review risk appetite – early batching start up Wider / echelon paving Review working patterns to maximise working time Safe areas for parking to reduce (un)loading Revise pavement spec., Larger scheme size, Measures for designer performance / plan quality Use PSV grade as location dictates rather than default Include supply chain expertise Programme visibility – certainty of funding leading to lower unit cost Payment / incentivisation Consider Regional Civils contract rather than CM pavements Warranty incentivisation Review life of HRA / thin surfacing Feedback to need decisions Use industry expertise to upskill asset condition modelling inc. deterioration. Value Mngt / Eng Process Actions Programme Actions Programme Capture efficiencies and report (Paul Doney Martin Bolt) £600 million 6 sub groups established taking ownership £600 million Communication of efficiency ideas 6 Sub-groups established taking ownership • Steering group challenges • How will we know whether we are on track? • Who do we report to & how often? Created by: Paul Doney Date: 24/8/15 Version: 1.0