Download
1 / 25
250 likes | 273 Views
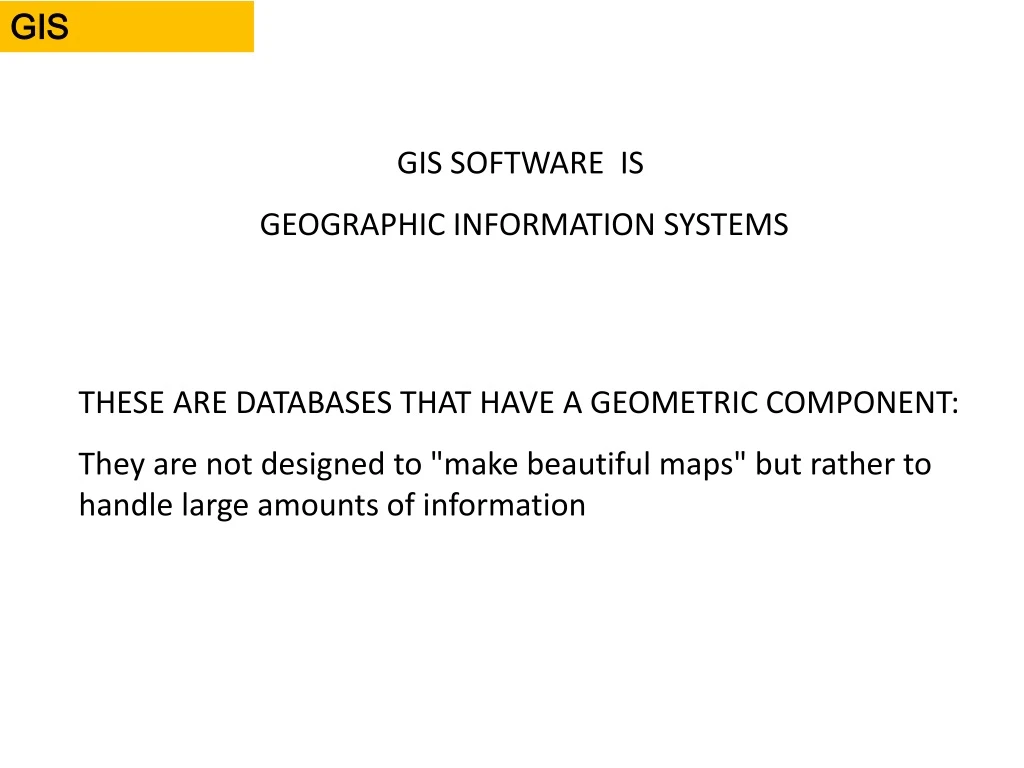
GIS. GIS SOFTWARE IS GEOGRAPHIC INFORMATION SYSTEMS. THESE ARE DATABASES THAT HAVE A GEOMETRIC COMPONENT: They are not designed to "make beautiful maps" but rather to handle large amounts of information. There are 2 kinds of GIS. RASTER GIS. Vectors GIS. Work on the pixel

E N D
GIS GIS SOFTWARE IS GEOGRAPHIC INFORMATION SYSTEMS THESE ARE DATABASES THAT HAVE A GEOMETRIC COMPONENT: They are not designed to "make beautiful maps" but rather to handle large amounts of information
There are 2 kinds of GIS RASTER GIS Vectors GIS Work on the pixel (we say cell) Work on the geometric shape • 1: Coordinate systems can be used • 2: We can operate (mathematical) operations on the data and therefore do spatial analysis
2 types of spatialized data A cadastral plan; a field.......... Spatial data by definition It can be seen in space and therefore on the map The name of the owner of the field....... Spatial data by destination It has no geometry but can be assigned to map objects
How is the data organized in a GIS? Like a thousand leaves! (in layers) In fact, we break down the real into as many categories as necessary This part isvery important in the modelisationprocess. You must choose if an information willbe organise by definition or destination And the type of spatial information iscrutial (Raster or vector)
RASTER GIS and spatial analysis TO ANALYZE CONTINUOUS PHENOMENA IN SPACE NUMERICAL APPROACH (map algebra) (work is done on the value matrix) Spatial analysis by Raster is very powerful identification of the best possible areas for a crop; to pass a road map precipitation or t° But the maps are verycomplex and not easy to understand
Example of spatial analysis by RASTER Spatial analysis to find the best areas to plant sorghum in Nakuru valley (Kenya) Sorghum bicolor 2005, sep 4 by pethanBotanical Gardens Utrecht University
The starting data Sources : Idrisi project Sources : Idrisi project
Our work will seek to keep only the right areas for precipitation and altitude 2 phases: • Select the right areas • combine them together
Selection of the best areas for altitude Sorghum appreciates altitudes between 7000 and 8500 feet The values of the card will be reclassified to make a new card that will contain only two types of values • 0 is the wrong areas • 1 it's the right ones
Last operation: mapalgebra Due to the properties of algebra, it is possible to find the areas that share these two conditions by using a simple multiplication because: • 0 X 0 = 0 • 0 X 1 = 0 • 1 X 0 = 0 • 1 X 1 = 1
And……. X =
We know that sorghum can be planted in areas with a value of 1 If we superimpose this map on a location map we can easily find our way around
VECTOR GIS Rather for the management or analysis of discrete phenomena in space (territorial organization; City; industrial establishment; advertising...) Databases with two categories of information • Spatial information • Attribute information
AS THESE ARE DATABASES, WE CAN "REQUEST" SQL
Wecananswergeographically (MAP) Which municipalities have a population of less than 10,000 and an unemployment rate of more than 9% unless they are located less than 10 km from a city with a HOSPITAL? This part of the requestis a topological information. It is not in the database but itiscalculated
EXAMPLE OF ANALYSIS BY VECTOR GIS The objective is to check the quality of the coverage of a city's crèche service. To see if the position of the crèches is relevant and if they do not compete with each other
The starting data : Spatial information by definition
Spatial information by definition destination Name Address TEL
Operation N°1: THE GEOCODAGE OF PARENTS Based on the address, we can place the "parent" objects on the map
Action 2: CREATE INFLUENCE ZONES making buffer zones from nurseries (here 1KM)
Step 3: With a TOPOLOGY function, create an object that will be the INTERSECTION of the two zones of influence We have highlighted an area where two crèches are in competition
Les formats de données • Structure de base de données • Georelationnel-------------------.gdb • Objet--------------------------------.gcm/gcr Topologie bouteille de Klein • Structure de fichiers «plats» vecteurs • Csv • Shp • Mif/mid • gcm/gcr • Dwg • Dgn • Dxf • Extentions raster communes • Geotif • Bil • Erdas • Jpeg……. • MrSID • Jpeg2000 La «révolution» PostgreSQL/postgis