Download
1 / 23
230 likes | 233 Views
This article explores the temporal, spatial, interpretive, and practical limitations of functional MRI (fMRI), as well as the costs and benefits in security evaluation. It also discusses the necessary improvements needed for fMRI research and compares MRI with fMRI. The basis of BOLD contrast and its imaging tasks are explained, along with activation statistics, ROI time courses, and the spatial and temporal resolution of fMRI. The clinical and future applications of fMRI are also discussed.

E N D
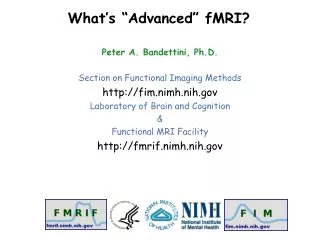
Functional MRI Peter A. Bandettini, Ph.D. Section on Functional Imaging Methods http://fim.nimh.nih.gov Laboratory of Brain and Cognition & Functional MRI Facility http://fmrif.nimh.nih.gov
How does fMRI Work? • Temporal, spatial, interpretive, practical limitations. • Costs/Benefits in Security Evaluation? • Necessary improvements - what needs to be known?
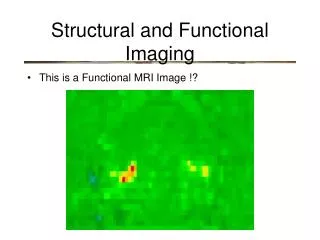
MRI vs. fMRI MRI fMRI one image Time … many images (e.g., every 2 sec for 5 mins) high resolution (1 mm or less) low resolution (1.5 to 4 mm)
BOLD (Blood Oxygen Level Dependent) Contrast blood flow oxygenated-blood MR signal
Basis of BOLD Contrast Oxygenated and deoxygenated red blood cells have different magnetic properties oxygenated deoxygenated red blood cells L. Pauling, C. D. Coryell, Proc.Natl. Acad. Sci. USA 22, 210-216, 1936. K.R. Thulborn, J. C. Waterton, et al., Biochim. Biophys. Acta. 714: 265-270, 1982. S. Ogawa, T. M. Lee, A. R. Kay, D. W. Tank, Proc. Natl. Acad. Sci. USA 87, 9868-9872, 1990.
BOLD Contrast Imaging task task • K. K. Kwong, et al, (1992) “Dynamic magnetic resonance imaging of human brain activity during primary sensory stimulation.” Proc. Natl. Acad. Sci. USA. 89, 5675-5679. • S. Ogawa, et al., (1992) “Intrinsic signal changes accompanying sensory stimulation: functional brain mapping with magnetic resonance imaging. Proc. Natl. Acad. Sci. USA.” 89, 5951-5955. • P. A. Bandettini, et al., (1992) “Time course EPI of human brain function during task activation.” Magn. Reson. Med 25, 390-397. • Blamire, A. M., et al. (1992). “Dynamic mapping of the human visual cortex by high-speed magnetic resonance imaging.” Proc. Natl. Acad. Sci. USA 89: 11069-11073.
Functional images Activation Statistics ROI Time Course fMRI Signal (% change) ~2s Condition Time Condition 1 Statistical Map superimposed on anatomical MRI image Time Condition 2 ... ~ 5 min Region of interest (ROI)
3 2 1 0 -1 Brain Map Column Layer NIRS NIRS PET MEG, EEG NIRS Log Size (mm) fMRI MRI -3 -2 -1 0 1 2 3 4 5 6 7 Millisecond Second Minute Hour Day Log Time (sec)
+ 2 sec Latency - 2 sec Magnitude Venogram Spatial and Temporal Resolution Latency Variation… Cheng, et al. (2001) Neuron,32:359-374 P. A. Bandettini, (1999) "Functional MRI" 205-220. Temporal Spatial
Interpretation Measured Signal Neuronal Activation ? ? ? ? Hemodynamics Noise
Type of fMRI research performed Motor Primary Sensory Integrative Sensory Basic Cognition High-Order Cognition Emotion J. Illes, M. P. Kirschen, J. D. E. Gabrielli, Nature Neuroscience, 6 (3) p.205, 2001
Clinical Applications Comparison of two groups of normal individuals with differences in the Serotonin Transporter Gene
group Individual activations from the left hemisphere of the 9 subjects SC NL KB EE JL HG BB BK CC Extensive Individual Differences in Brain Activations During Episodic Retrieval Miller et al., 2002 Courtesy, Mike Miler, UC Santa Barbara and Jack Van Horn, fMRI Data Center, Dartmouth University
Subject SC Subject SC 6 months later These individual patterns of activations are stable over time Group Analysis of Episodic Retrieval Courtesy, Mike Miler, UC Santa Barbara and Jack Van Horn, fMRI Data Center, Dartmouth University
The problem of drawing individual inferences from fMRI data: When comparing two groups, if one group shows a difference in activation, it does not imply that an individual that shows a similar difference is in that group.
Motion sensitivity Overt Word Production 3 2 4 5 7 6 8 9 11 10 12 13
Concluding thoughts.. Very difficult to draw individual inferences. Needs individual calibration. (example: face recognition..) Practically, very difficult to implement. (requires considerable subject cooperation)
Uses Understanding normal brain organization and changes -networks involved with specific tasks (low to high level processing) -changes over time (seconds to years) -correlates of behavior (response accuracy, performance changes…) Clinical research -correlates of specifically activated networks to clinical populations -presurgical mapping Future Uses Complementary use for clinical diagnosis -utilization of clinical research results -prediction of pathology Clinical treatment and assessment -drug, therapy, rehabilitation, biofeedback -epileptic foci mapping -drug effects Non clinical uses -complementary use with behavioral, anatomical, other modality results -lie detection -prediction of behavior tendencies -brain/computer interface