Download
1 / 61
610 likes | 615 Views
This article explores the latest advancements in functional MRI technology, methodologies, and applications. Topics covered include high field strength, multi-channel coils, pulse sequences, higher spatial resolution techniques, and improved temporal resolution. The importance of sensitivity, spatial resolution, and temporal resolution in enhancing the quality and interpretation of fMRI images is discussed. Applications in various fields, such as neuroscience, clinical populations, and cognitive neuroscience, are also highlighted.

E N D
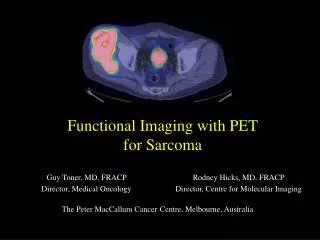
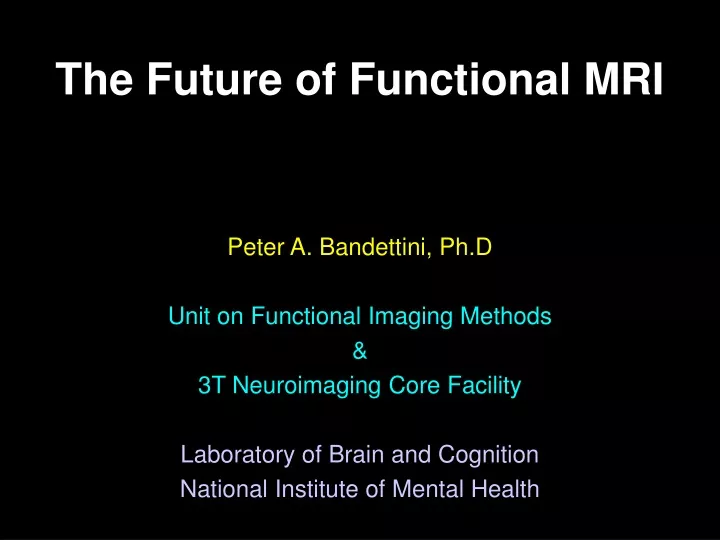
The Future of Functional MRI Peter A. Bandettini, Ph.D Unit on Functional Imaging Methods & 3T Neuroimaging Core Facility Laboratory of Brain and Cognition National Institute of Mental Health
Diff. tensor Technology Mg+ 7T >8 channels 1.5T,3T, 4T EPI on Clin. Syst. Venography Real time fMRI EPI SENSE Nav. pulses Local Human Head Gradient Coils Quant. ASL Z-shim Baseline Susceptibility MRI Dynamic IV volume Spiral EPI ASL Current Imaging? BOLD Simultaneous ASL and BOLD Multi-shot fMRI Correlation Analysis CO2 Calibration Methodology Motion Correction Mixed ER and Blocked Parametric Design Multi-Modal Mapping Surface Mapping Baseline Volume Free-behavior Designs ICA Phase Mapping Mental Chronometry Linear Regression Multi-variate Mapping IVIM Deconvolution Fuzzy Clustering Event-related BOLD models PET correlation Interpretation IV vs EV ASL vs. BOLD Bo dep. Pre-undershoot PSF of BOLD Linearity mapping TE dep Resolution Dep. Extended Stim. Blood T2 Post-undershoot Metab. Correlation Linearity SE vs. GE CO2 effect Optical Im. Correlation Hemoglobin Fluctuations NIRS Correlation Veins Balloon Model Electrophys. correlation Inflow Complex motor Applications Memory Imagery Emotion Language Children Drug effects Motor learning Tumor vasc. BOLD -V1, M1, A1 Presurgical Ocular Dominance Attention Volume - Stroke Clinical Populations V1, V2..mapping Priming/Learning D Volume-V1 Performance prediction Plasticity Face recognition 36 82 88 89 90 91 92 93 94 95 96 97 98 99 00 01 02
Technology Methodology Physicist Engineer Computer Scientist Statistician Clinician Basic Neuroscientist Cog Neuroscientist Physiologist Interpretation Applications
Where fMRI Will Improve: • Sensitivity • Spatial Resolution • Temporal Resolution • Image Quality • Interpretation • Experimental • Design/Execution/Analysis
Why do we need Sensitivity? • More signal exists • More information in the fluctuations • Allows shorter scan times • Allows more subtle comparisons • Allows higher resolution
CC Histogram Continuously Growing Activation Area Inflection Point Z. S. Saad, K. M. Ropella, E. A. DeYoe, P. A. Bandettini, The spatial extent of the BOLD response. NeuroImage, (in press).
Williams, D. S., Detre, J. A., Leigh, J. S. & Koretsky, A. S. (1992) “Magnetic resonance imaging of perfusion using spin-inversion of arterial water.” Proc. Natl. Acad. Sci. USA 89, 212-216. Edelman, R., Siewert, B. & Darby, D. (1994) “Qualitative mapping of cerebral blood flow and functional localization with echo planar MR imaging ans signal targeting with alternating radiofrequency (EPISTAR).” Radiology 192, 1-8. Kim, S.-G. (1995) “Quantification of relative cerebral blood flow change by flow-sensitive alternating inversion recovery (FAIR) technique: application to functional mapping.” Magn. Reson. Med. 34, 293-301. Kwong, K. K. et al. (1995) “MR perfusion studies with T1-weighted echo planar imaging.”Magn. Reson. Med. 34, 878-887.
How to Increase Sensitivity? • Higher field strength • More and Smaller RF coils • Pulse sequences?
8 Channel Array Quadrature Head Coil SNR 128 x 96 64 x 48 TSNR 128 x 96
Why to we need higher spatial resolution? • Greater delineation of function • Possible gain in contrast to noise • Reduction of signal dropout • Better registration with high res. Anatomy • With Regard to functional resolution: calibration
Ocular Dominance Column Mapping using fMRI calcarine Menon, R. S., S. Ogawa, et al. (1997). “Ocular dominance in human V1 demonstrated by functional magnetic resonance imaging.” J Neurophysiol 77(5): 2780-7. Optical Imaging R. D. Frostig et. al, PNAS 87: 6082-6086, (1990).
How to Increase Resolution? • Multi-shot Imaging (with navigators) • Partial k-space • Parallel imaging (SENSE, SMASH, etc..)
Single Shot EPI T2* decay EPI Readout Window ≈ 20 to 40 ms
T2* decay EPI Window 1 Multishot Imaging T2* decay EPI Window 2
T2* decay EPI Window Partial k-space imaging
SENSE Imaging ≈ 5 to 30 ms Pruessmann, et al.
Why do we need higher temporal resolution? • More slices per volume • Better delineation of hemodynamic response • Possibly better delineation of cascaded neuronal activity
How to Increase temporal resolution? • Asynchronous task and TR timing • Reduce readout window width • Increased averaging • Focus on modulation of task timing • Calibration?
sdelay = 107ms 1 run: 1% Noise 4% BOLD 256 time pts /run 1 second TR Number t -1000 -500 0 500 1000 delay estimate (ms) 500 400 16 sec on/off Smallest latency Variation Detectable (ms) (p < 0.001) 300 8 sec on/off 200 100 0 0 5 10 15 20 25 30 11 Number of runs
Measured Signal Neuronal Activation ? ? ? Hemodynamics Noise
+ 2 sec Latency - 2 sec Magnitude
9.0 seconds 15 seconds 500 msec 500 msec 20 30 10 Time (seconds) Hemi-Field Experiment Left Hemisphere Right Hemisphere
500 ms 500 ms RightHemifield Left Hemifield + 2.5 s - = 0 s - 2.5 s
Hemodynamic Response Modulation Bottleneck In Processing (upstream) Delayed Processing (downstream)
Our first attempt to apply this strategy.. P.S.F. Bellgowan, Z. S. Saad, P. A. Bandettini, Understanding neural system dynamics through task modulation and measurement of BOLD amplitude, latency, and width.Proc. Nat'l. Acad. Sci. USA(in press).
Use of Task Timing Modulation to Extract Processing Streams Stimuli – Six-letter English words and pronounceable non-words. Each word or non-word was rotated either 0, 60,or 120 degrees Task – Lexical Decision (word / non-word). Dependent Measures – Percent Correct and Reaction Time. Hypotheses : 1) Stimulus rotation of 120 degrees will result in: a) Longer Reaction Times b) Stimulus rotation demands a change in perceptual perspective prior to linguistic processing, resulting in a delayed IRF onset in areas involved in Lexical and Pre-Lexical processing. 2) Lexical discrimination will result in : a) Longer Reaction Times for non-words due to increased Pre-Lexical processing demands. b) Wider IRF in Inferior Frontal cortex for non-words c) Delayed IRF onset in Left Middle Frontal Cortex
Lexical Delay Mean Reaction Time Words Non-Words 823 ms smudge dierts 00 Rotational Delay frolic cuhlos 891 ms 600 1446 ms slouch gedmus 1200 Mean Reaction Time 986 ms 1219 ms
w 1 a Amp. d 0 0 0 5 10 15 0 5 10 15 Estimation of Delay, Width & Amplitude Conv. time (s) Adjust d, w, a to improve fit (Nelder-Mead simplex method) 20 0 0 5 10 15
s40 s40 s40 s30 s30 s30 s20 s20 s20 s10 s10 s10 s0 s0 s0 i10 i10 i10 p < 10 -6 p < 10 -5 p < 10 -4 p < 10 -3 p < 10 -2 L R Time Difference In msec > 300 L 250 to 300 R 200 to 250 150 to 200 100 to 150 L R Lexical effect maps Magnitude Delay Width Warm colors are areas where Words > Non-words. Cool colors (blues) are areas. Where Non-words > words. The Left hemisphere is toward the left margin. The green arrows highlight the inferior frontal gyrus.
Rotational effect maps s50 s35 s20 s05 i10 s40 s30 s20 s10 s0 i10 p < 10 -6 p < 10 -5 p < 10 -4 p < 10 -3 Magnitude p < 10 -2 Non-rotated vs. 60o rotated Non-rotated vs. 120o rotated Delay Width
A A A B B B Word vs. Non-word 0o, 60o, 120o Rotation Regions of Interest Inferior Frontal Gyrus Precentral Gyrus Middle Temporal Gyrus
What is needed in image quality? • Reduction of warping • Reduction of signal dropout • Reduction of ghosting, etc. artifacts
Improving Image Quality • Reduction of warping • Shorter readout window length (SENSE, etc..) • Shimming • Reduction of signal dropout • Shimming • Pulse sequence correction (Z-shim, etc..) • Smaller voxel volumes • Reduction of ghosting, etc. artifacts • Better phase correction • Better coil performance
Interpretation • More direct neuronal information • More quantitative physiologic information
D Neuronal Activity Number of Neurons Local Field Potential Spiking Coherence Spiking Rate D Metabolism Aerobic Metabolism Anaerobic Metabolism - Blood Volume Deoxygenated Blood D Hemodynamics - Flow Velocity Oxygenated Blood + Perfusion D BOLD Contrast D Deoxy-Hb MRI Pulse Sequence D Perfusion Contrast D Inflow Contrast
Measured Signal Neuronal Activation ? ? ? Hemodynamics Noise
time (s) Dynamic Nonlinearity Assessment Different stimulus “ON” periods measured linear BOLD Response Signal Stimulus timing 0.25 s 0.5 s 1 s 2 s 20 s Brief stimuli produce larger responses than expected R. M. Birn, Z. Saad, P. A. Bandettini, (2001) “Spatial heterogeneity of the nonlinear dynamics in the fMRI BOLD response.” NeuroImage, 14: 817-826.
8 f (SD) 6 4 2 0 10 20 30 40 0 1 2 3 4 5 0 10 20 30 40 Stimulus Duration -2 8 f (SD) 6 60 4 40 2 20 0 1 2 3 4 5 0 2 0 2 4 6 8 Stimulus Duration -2 nonlinearity Spatial Heterogeneity of BOLD Nonlinearity R. M. Birn, Z. Saad, P. A. Bandettini, (2001) “Spatial heterogeneity of the nonlinear dynamics in the fMRI BOLD response.” NeuroImage, 14: 817-826.
Sources of this Nonlinearity • Neuronal • Hemodynamic • Oxygen extraction • Blood volume dynamics Oxygen Extraction Flow In Flow Out D Volume
BOLD Correlation with Neuronal Activity Logothetis et al. (2001) “Neurophysiological investigation of the basis of the fMRI signal” Nature, 412, 150-157. P. A. Bandettini and L. G. Ungerleider, (2001) “From neuron to BOLD: new connections.” Nature Neuroscience, 4: 864-866.
Computed CMRO2 Changes 40 30 20 10 0 % % -10 -20 -30 -40 Subject 2 Subject 1
CBF OEF CMRO2
Neuronal Current Imaging • Neuronal activity is directly associated with ionic currents. • These bio-currents induce spatially distributed and transient magnetic flux density changes and magnetic field gradients. • In the context of MRI, these currents therefore alter the magnetic phase of surrounding water protons.
Z X BR<2nT BR<0.2nT J. Bodurka, P. A. Bandettini. Toward direct mapping of neuronal activity: MRI detection of ultra weak transient magnetic field changes, Magn. Reson. Med. 47: 1052-1058, (2002).
1 2 detection of neuronal currents in vitro results 1: culture 2: CSF CSF Culture C C A A B B FSE image Hz Hz Active state: black line, Inactive state: red line A: activity, on-off frequency (appx. 7 sec) B: activity C: scanner noise (cooling-pump)
Phase v=0.12Hz Closed Open Power spectra Eyes closed Eyes open 0.5 Hz 0.5 Hz