Download
1 / 21
240 likes | 288 Views
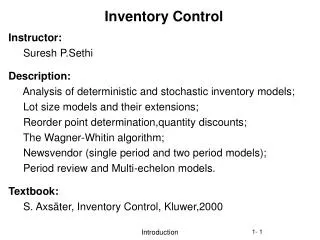
Inventory Control. OBJECTIVES. Inventory System Defined Inventory Costs Independent vs. Dependent Demand Single-Period Inventory Model Multi-Period Inventory Models: Basic Fixed-Order Quantity Models Multi-Period Inventory Models: Basic Fixed-Time Period Model

E N D
OBJECTIVES • Inventory System Defined • Inventory Costs • Independent vs. Dependent Demand • Single-Period Inventory Model • Multi-Period Inventory Models: Basic Fixed-Order Quantity Models • Multi-Period Inventory Models: Basic Fixed-Time Period Model • Miscellaneous Systems and Issues
Inventory SystemDefined • Inventory is the stock of any item or resource used in an organization and can include: raw materials, finished products, component parts, supplies, and work-in-process • An inventory system is the set of policies and controls that monitor levels of inventory and determines what levels should be maintained, when stock should be replenished, and how large orders should be
Purposes of Inventory 1. To maintain independence of operations 2. To meet variation in product demand 3. To allow flexibility in production scheduling 4. To provide a safeguard for variation in raw material delivery time 5. To take advantage of economic purchase-order size
Inventory Costs • Holding (or carrying) costs • Costs for storage, handling, insurance, etc • Setup (or production change) costs • Costs for arranging specific equipment setups, etc • Ordering costs • Costs of someone placing an order, etc • Shortage costs • Costs of canceling an order, etc
Independent Demand (Demand for the final end-product or demand not related to other items) Dependent Demand (Derived demand items for component parts, subassemblies, raw materials, etc) Independent vs. Dependent Demand Finished product E(1) Component parts
Inventory Systems • Single-Period Inventory Model • One time purchasing decision (Example: vendor selling t-shirts at a football game) • Seeks to balance the costs of inventory overstock and under stock • Multi-Period Inventory Models • Fixed-Order Quantity Models • Event triggered (Example: running out of stock) • Fixed-Time Period Models • Time triggered (Example: Monthly sales call by sales representative)
Multi-Period Models:Fixed-Order Quantity Model Model Assumptions (Part 1) • Demand for the product is constant and uniform throughout the period • Lead time (time from ordering to receipt) is constant • Price per unit of product is constant
Multi-Period Models:Fixed-Order Quantity Model Model Assumptions (Part 2) • Inventory holding cost is based on average inventory • Ordering or setup costs are constant • All demands for the product will be satisfied (No back orders are allowed)
4. The cycle then repeats. 1. You receive an order quantity Q. Number of units on hand Q Q Q R L L 2. Your start using them up over time. 3. When you reach down to a level of inventory of R, you place your next Q sized order. Time R = Reorder point Q = Economic order quantity L = Lead time Basic Fixed-Order Quantity Model and Reorder Point Behavior
Total Cost Annual Cost of Items (DC) QOPT Cost Minimization Goal By adding the item, holding, and ordering costs together, we determine the total cost curve, which in turn is used to find the Qopt inventory order point that minimizes total costs C O S T Holding Costs Ordering Costs Order Quantity (Q)
Basic Fixed-Order Quantity (EOQ) Model Formula TC=Total annual cost D =Demand C =Cost per unit Q =Order quantity S =Cost of placing an order or setup cost R =Reorder point L =Lead time H=Annual holding and storage cost per unit of inventory Total Annual = Cost Annual Purchase Cost Annual Ordering Cost Annual Holding Cost + +
Deriving the EOQ Using calculus, we take the first derivative of the total cost function with respect to Q, and set the derivative (slope) equal to zero, solving for the optimized (cost minimized) value of Qopt We also need a reorder point to tell us when to place an order
EOQ Example (1) Problem Data Given the information below, what are the EOQ and reorder point? Annual Demand = 1,000 units Days per year considered in average daily demand = 365 Cost to place an order = $10 Holding cost per unit per year = $2.50 Lead time = 7 days Cost per unit = $15
EOQ Example (1) Solution In summary, you place an optimal order of 90 units. In the course of using the units to meet demand, when you only have 20 units left, place the next order of 90 units.
EOQ Example (2) Problem Data Determine the economic order quantity and the reorder point given the following… Annual Demand = 10,000 units Days per year considered in average daily demand = 365 Cost to place an order = $10 Holding cost per unit per year = 10% of cost per unit Lead time = 10 days Cost per unit = $15
EOQ Example (2) Solution Place an order for 366 units. When in the course of using the inventory you are left with only 274 units, place the next order of 366 units.
q = M - I Actual Inventory Level, I I Miscellaneous Systems:Optional Replenishment System Maximum Inventory Level, M M Q = minimum acceptable order quantity If q > Q, order q, otherwise do not order any.
Full Empty One-Bin System Periodic Check Miscellaneous Systems:Bin Systems Two-Bin System Order One Bin of Inventory Order Enough to Refill Bin
60 % of $ Value A 30 B 0 C % of Use 30 60 ABC Classification System • Items kept in inventory are not of equal importance in terms of: • dollars invested • profit potential • sales or usage volume • stock-out penalties So, identify inventory items based on percentage of total dollar value, where “A” items are roughly top 15 %, “B” items as next 35 %, and the lower 65% are the “C” items
Inventory Accuracy and Cycle CountingDefined • Inventory accuracy refers to how well the inventory records agree with physical count • Cycle Counting is a physical inventory-taking technique in which inventory is counted on a frequent basis rather than once or twice a year