Download
1 / 2
20 likes | 115 Views
-McNeil, C. and L. Merlivat, The warm oceanic surface layer: Implications for CO2 fluxes and surface gas measurements, Geophysical Research Letters , 23, 3575-3578, 1996.

E N D
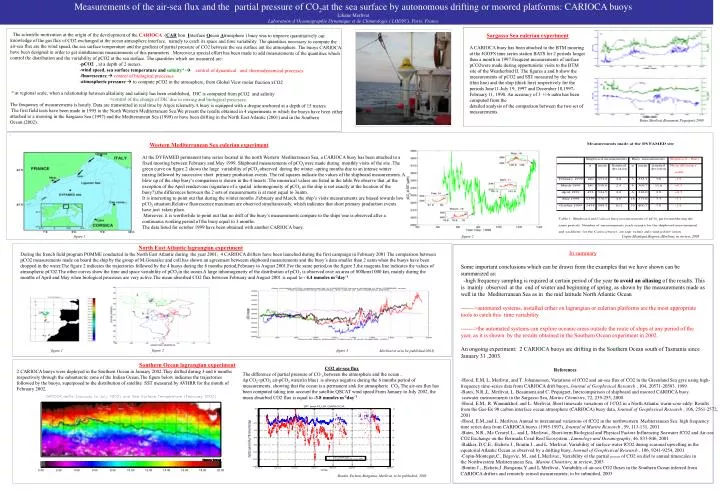
-McNeil, C. and L. Merlivat, The warm oceanic surface layer: Implications for CO2 fluxes and surface gas measurements, Geophysical Research Letters , 23, 3575-3578, 1996. -Hood, E.M, L. Merlivat, and T. Johannessen, Variations of fCO2 and air-sea flux of CO2 in the Greenland Sea gyre using high-frequency time-series data from CARIOCA drift buoys, Journal of Geophysical Research , 104, 20571-20583, 1999. -Bates, N.R.,L. Merlivat, L. Beaumont.and C. Pequignet, Intercomparison of shipboard and moored CARIOCA buoy seawater measurements in the Sargasso Sea, Marine Chemistry, 72, 239-255, 2000 -Hood, E.M., R. Wanninkhof, and L. Merlivat, Short timescale variations of f CO2 in a North Atlantic warm-core eddy: Results from the Gas-Ex 98 carbon interface ocean atmosphere (CARIOCA) buoy data, Journal of Geophysical Research , 106, 2561-2572, 2001 -Hood, E.M.,and L. Merlivat, Annual to interannual variations of fCO2 in the northwestern Mediterranean Sea: high frequency time series data from CARIOCA buoys (1995-1997), Journal of Marine Research , 59, 113-131, 2001 -Bates, N.R., Mc Crearyl L., and L. Merlivat., Short-term Biological and Physical Factors Influencing Seawater fCO2 and Air-sea CO2 Exchange on the Bermuda Coral Reef Ecosystem., Limnology and Oceanography, 46, 833-846, 2001 -Bakker, D.C.E., Etcheto J., Boutin J., and L. Merlivat, Variability of surface-water fCO2 during seasonal upwelling in the equatorial Atlantic Ocean as observed by a drifting buoy, Journal of Geophysical Research , 106, 9241-9254, 2001 --Copin-Montegut,C., Begovic, M., and L.Merlivat., Variability of the partial pressure of CO2 on diel to annual timescales in the Northwestern Mediterranean Sea, Marine Chemistry, in review, 2003 -Gonzalez Davila, M., Santana-Casiano, J.M., Merlivat.,L., and E.V.Dafner .,Fluxes of CO2 between the atmosphere and ocean during POMME Project in the North-East Atlantic Ocean, submitted to Deep Sea Research, November 12, 2002. Measurements of the air-sea flux and the partial pressure of CO2at the sea surface by autonomous drifting or moored platforms: CARIOCA buoys Liliane Merlivat Laboratoire d’Oceanographie Dynamique et de Climatologie ( LODYC), Paris, France Sargasso Sea eulerian experiment A CARIOCA buoy has been attached to the BTM mooring at the JGOFS time series station BATS for 2 periods longer than a month in 1997.Frequent measurements of surface pCO2were made during opportunistic visits to the BTM site of the Weatherbird II. The figures a and b show the measurements of pCO2 and SST measured by the buoy (thin line) and the ship (thick line) respectively for the periods June11-July 19, 1997 and December 10,1997-February 11, 1998. An accuracy of 3 +/-6 uatm has been computed from the detailed analysis of the comparison between the two set of measurements. The scientific motivation at the origin of the development of the CARIOCA (CAR bon Interface Ocean Atmosphere ) buoy was to improve quantitatively our knowledge of the gas flux of CO2 exchanged at the ocean atmosphere interface, namely to catch its space and time variability. The quantities necessary to compute the air-sea flux are the wind speed, the sea surface temperature and the gradient of partial pressure of CO2 between the sea surface ant the atmosphere. The buoys CARIOCA have been designed in order to get simultaneous measurements of this parameters . Moreover,a special effort has been made to add measurements of the quantities which control the distribution and the variability of pCO2 at the sea surface. The quantities which are measured are: -pCO2 , at a depth of 2 meters. -wind speed, sea surface temperature and salinity*-control of dynamical and thermodynamical processes -fluorescencecontrol of biological processes -atmospheric pressure to compute pCO2 in the atmosphere, from Global View molar fraction xCO2 *:at regional scale, when a relationship between alkalinity and salinity has been established, DIC is computed from pCO2 and salinity >control of the change of DIC due to mixing and biological processes. The frequency of measurements is hourly. Data are transmitted in real time by Argos telemetry.A buoy is equipped with a drogue anchored at a depth of 15 meters The first field tests have been made in 1995 in the North Western Mediterranean Sea.We present the results obtained in 4 experiments in which the buoys have been either attached to a mooring in the Sargasso Sea (1997) and the Mediterranean Sea (1999) or have been drifting in the North East Atlantic (2001) and in the Southern Ocean.(2002). . Bates,Merlivat,Beaumont,Pequignet,2000 Western Mediterranean Sea eulerian experiment At the DYFAMED permanent time series located in the north Western Mediterranean Sea, a CARIOCA buoy has been attached to a fixed mooring between February and May 1999. Shipboard measurements of pCO2were made during monthly visits of the site .The green curve on figure 2 shows the large variability of pCO2 observed during the winter -spring months due to an intense winter mixing followed by successive short primary production events. The red squares indicate the values of the shipboard measurements. A blow up of the ship buoy’s comparison is shown in the 4 inserts .The numerical values are listed in the table.We observe that ,at the exception of the April rendezvous (signature of a spatial inhomogoneity of pCO2 as the ship is not exactly at the location of the buoy?),the differences between the 2 sets of measurements is at most equal to 3uatm. It is interesting to point out that during the winter months ,February and March, the ship’s visits measurements are biased towards low pCO2 situation.Relative fluorescence maximum are observed simultaneously, whixh indicates that short primary production events have just taken place. Moreover, it is worthwhile to point out that no drift of the buoy’s measurements compare to the ships’one is observed after a continuous working period of the buoy equal to 3 months. The data listed for october 1999 have been obtained with another CARIOCA buoy. figure 1 figure 2 Copin-Montegut,Begovic,Merlivat, in review, 2003 North East Atlantic lagrangian experiment During the french field program POMME conducted in the North East Atlantic during the year 2001, 4 CARIOCA drifters have been launched during the first campaign in February 2001 The comparison between pCO2 measurements made on board the ship by the group of M.Gonzalez and coll.has shown an agreement betweem shipboard measurements and the buoy’s data smaller than 2 uatm when the buoys have been dropped in the water.The figure 2 indicates the trajectories followed by the 4 buoys during the 6 months period,February to August 2001.For the same period,on the figure 3,the magenta line indicates the values of atmospheric pCO2.The other curves show the time and space variability of pCO2in the ocean.A large inhomogeneity of the distribution of pCO2 is observed over an area of 800kmx1000 km, mainly during the months of April and May when biological processes are very active.The mean absorbed CO2 flux between February and August 2001 is equal to - 4.4mmoles m-2day-1 • In summary • Some important conclusions which can be drawn from the examples that we have shown can be summarized as: • -high frequency sampling is required at certain period of the year to avoid an aliasing of the results. This is mainly observed at the end of winter and beginning of spring, as shown by the measurements made as well in the Mediterranean Sea as in the mid latitude North Atlantic Ocean • ------>automated systems, installed either on lagrangian or eulerian platforms are the most appropriate tools to catch this time variability • ------->the automated systems can explore oceanic areas outside the route of ships at any period of the year, as it is shown by the results obtained in the Southern Ocean experiment in 2002. • An ongoing experiment: 2 CARIOCA buoys are drifting in the Southern Ocean south of Tasmania since January 31 ,2003. figure 2 figure 1 figure 3 Merlivat et al,to be published,2003) Southern Ocean lagrangian experiment 2 CARIOCA buoys were deployed in the Southern Ocean in January 2002.They drifted during 3 and 6 months respectively through the subantarctic zone of the Indian Ocean.The figure below indicates the trajectories followed by the buoys, superposed to the distribution of satellite SST measured by AVHRR for the month of February 2002. CO2 air-sea flux The difference of partial pressure of CO 2 between the atmosphere and the ocean , ∆p CO2=pCO2 air-pCO2 water(in blue) is always negative during the 6 months period of measurements, showing that the ocean is a permanent sink for atmospheric CO2.The air-sea flux has been computed taking into account the satellite QSCAT wind speed.From January to July 2002, the mean absorbed CO2 flux is equal to -3.8 mmoles m-2day-1 References -Hood, E.M, L. Merlivat, and T. Johannessen, Variations of fCO2 and air-sea flux of CO2 in the Greenland Sea gyre using high-frequency time-series data from CARIOCA drift buoys, Journal of Geophysical Research , 104, 20571-20583, 1999. -Bates, N.R.,L. Merlivat, L. Beaumont.and C. Pequignet, Intercomparison of shipboard and moored CARIOCA buoy seawater measurements in the Sargasso Sea, Marine Chemistry, 72, 239-255, 2000 -Hood, E.M., R. Wanninkhof, and L. Merlivat, Short timescale variations of f CO2 in a North Atlantic warm-core eddy: Results from the Gas-Ex 98 carbon interface ocean atmosphere (CARIOCA) buoy data, Journal of Geophysical Research , 106, 2561-2572, 2001 -Hood, E.M.,and L. Merlivat, Annual to interannual variations of fCO2 in the northwestern Mediterranean Sea: high frequency time series data from CARIOCA buoys (1995-1997), Journal of Marine Research , 59, 113-131, 2001 -Bates, N.R., Mc Crearyl L., and L. Merlivat., Short-term Biological and Physical Factors Influencing Seawater fCO2 and Air-sea CO2 Exchange on the Bermuda Coral Reef Ecosystem., Limnology and Oceanography, 46, 833-846, 2001 -Bakker, D.C.E., Etcheto J., Boutin J., and L. Merlivat, Variability of surface-water fCO2 during seasonal upwelling in the equatorial Atlantic Ocean as observed by a drifting buoy, Journal of Geophysical Research , 106, 9241-9254, 2001 -Copin-Montegut,C., Begovic, M., and L.Merlivat., Variability of the partial pressure of CO2 on diel to annual timescales in the Northwestern Mediterranean Sea, Marine Chemistry, in review, 2003 -Boutin J.,.,Etcheto,J.,Rangama,Y.,and L.Merlivat., Variability of air-sea CO2 fluxes in the Southern Ocean inferred from CARIOCA drifters and remotely sensed measurements, to be submitted, 2003 Boutin, Etcheto,Rangama, Merlivat, to be published, 2003