Download
1 / 49
500 likes | 513 Views
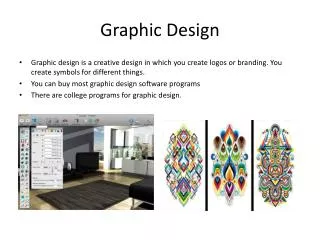
Graphic Design Principles. Acknowledgement: Slides adopted from MIT opencourseware “User Interface Design and Implementation”. Guidelines for Good Graphic Design. Simplicity Contrast White space Balance Alignment. Simplicity.

E N D
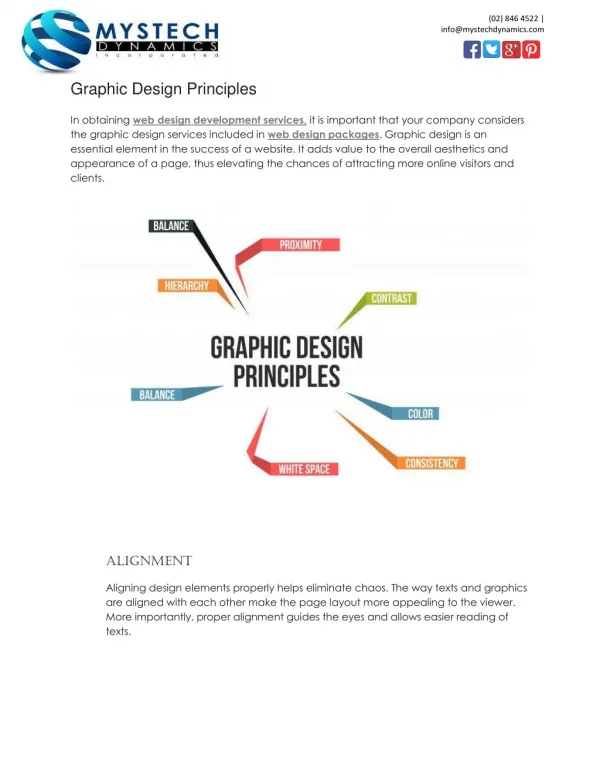
Graphic Design Principles Acknowledgement: Slides adopted from MIT opencourseware “User Interface Design and Implementation”
Guidelines for Good Graphic Design • Simplicity • Contrast • White space • Balance • Alignment
Simplicity “Perfection is achieved not when there is nothing more to add, but when there is nothing left to take away. (Antoine de St-Exupery) Simplicity does not mean the absence of any décor. It only means that the decor should belong intimately to the design proper, and that anything foreign to it should be taken away. (Paul Jacques Grillo) Keep it simple, stupid. (KISS) Less is more. When in doubt, leave it out. 3
Techniques for Simplicity: Reduction Remove inessential elements 4
Three ways to make a design simpler Reduction means that you eliminate whatever isn’t necessary. This technique has three steps: Decide what essentially needs to be conveyed by the design; Critically examine every element (label, control, color, font, line weight) to decide whether it serves an essential purpose; Remove it if it isn’t essential. Even if it seems essential, try removing it anyway, to see if the design falls apart. 5
The use of icon Icons demonstrate the principle of reduction well. 6
Techniques for simplicity: Regularity Use a regular pattern Limit inessential variation among elements 7
Techniques for simplicity: Regularity For the essential elements that remain, consider how you can minimize the unnecessary differences between them with regularity. Use the same font, color, line width, dimensions, orientation for multiple elements. Irregularities in your design will be magnified in the user’s eyes and assigned meaning and significance. Conversely, if your design is mostly regular, the elements that you do want to highlight will stand out better. PowerPoint’s Text Layouts menu shows both reduction (minimalist icons representing each layout) and regularity. Titles and bullet lists are shown the same way. 8
Techniques for simplicity: Double Duty Combine elements for leverage Find a way for one element to play multiple roles 9
Techniques for simplicity: Double Duty You can combine elements, making them serve multiple roles in the design. The desktop interface has a number of good examples of this kind of design. The “thumb” in a scroll bar actually serves three roles. affords dragging indicates the position of the scroll window relative to the entire document, and Indicates the fraction of the document displayed in the scroll window. 10
Techniques for simplicity: Double Duty You can combine elements, making them serve multiple roles in the design. The desktop interface has a number of good examples of this kind of design. Similarly, a window’s title bar plays several roles: Label dragging handle window activation indicator, and location for window control buttons. 11
Contrast and Visual Variables Contrast encodes information along visual dimensions 12
Contrast and Visual Variables Contrast encodes information along visual dimensions Contrast refers to perceivable differences along a visual dimension, such as size or color. Contrast is the irregularity in a design that communicates information or makes elements stand out. 13
Contrast and Visual Variables Contrast encodes information along visual dimensions Simplicity says we should eliminate unimportant differences. Once we’ve decided that a difference is important, however, we should choose the dimension and degree of contrast in such a way that the difference is salient, easily perceptible, and appropriate to the task. 14
Contrast and Visual Variables Contrast encodes information along visual dimensions Crucial to this decision is an understanding of the different visual dimensions. Jacques Bertin developed a theory of visual variables that is particularly useful here (Bertin, Graphics and Graphics Information Processing, 1989). 15
Contrast and Visual Variables The seven visual variables 16
Contrast and Visual Variables Hue is described with the words we normally think of as describing color: red, purple, blue, etc. Hue is more specifically described by the dominant wavelength in models such as the CIE system. Hue is also a term which describes a dimension of color we readily experience when we look at color. It will be the first of three dimensions we use to describe color. The Hue, Saturation, Value (HSV) color model 17
Contrast and Visual Variables The Hue, Saturation, Value (HSV) color model 18
Characteristics of Visual Variables Scale = kinds of comparisons possible Nominal (=) All variables Ordered (<, >) Ordered: position, size, value, texture granularity Not ordered: orientation, hue, shape Quantitative (amount of difference) Quantitative: position, size Not quantitative: value, texture, orientation, hue, shape Length = number of distinguishable levels Shape is very long (infinite variety) Position is long and fine-grained Orientation is very short (~ 4 levels) Other variables are in between (~ 10 levels) 19
Attention http://en.wikipedia.org/wiki/Attention 20
Selectivity Selective perception: can attention be focused on one value of the variable, excluding other variables and values? Selective: position, size, orientation, hue, value, texture Not selective: shape 21
Selectivity Ask yourself these questions: - find all the letters on the left half of the page (position) - find all the red letters (hue) - find all the K’s (shape) Which of these questions felt easy to answer, and which felt hard? The easy ones were selective visual variables. 22
Associativity Associative perception: can variable be ignored when looking at other variables? Associative: position, hue, value, texture, shape, orientation Not associative: size, value Small size and low value interfere with ability to perceive hue, value, texture, and shape 23
Techniques for Contrast Choose appropriate visual variables Use as much length as possible Sharpen distinctions for easier perception Multiplicative scaling, not additive Redundant coding where needed Cartoonish exaggeration where needed Use the “squint test” 25
Techniques for Contrast Choose the right visual variable For example, consider a text content hierarchy: title, chapter, section, body text, footnote. The data requires an ordered visual variable; a purely nominal variable like shape (e.g., font family) would not by itself be able to communicate the hierarchy ordering. 26
Techniques for Contrast Choose the right visual variable Choose variable values in such a way as to make sharp, easily perceptible distinctions between them. Multiplicative scaling (e.g., size growing by a factor of 1.5 or 2 at each successive level) is makes sharper distinctions than additive scaling (e.g., adding 5 pixels at each successive level). 27
Techniques for Contrast Choose the right visual variable You can also use redundant coding, in several visual variables, to enhance important distinctions further. The title of a document is not only larger (size), but it’s also centered (position), bold (value), and maybe a distinct color as well. Exaggerated differences can be useful, particularly when you’re drawing icons: like a cartoonist, you have to give objects exaggerated proportions to make them easily recognizable. 28
Techniques for Contrast Choose the right visual variable The squint test is a technique that simulates early visual processing, so you can see whether the contrasts you’ve tried to establish are readily apparent. Close one eye and squint the other, to disrupt your focus. Whatever distinctions you can still make out will be visible “at a glance.” 29
Choosing Visual Variable for Display Spam flag: nominal, 2 levels (spam or not) Subject: nominal (but can be ordered alphabetically), infinite (but maybe only ~100 are active) Sender: nominal (but can be ordered alphabetically), infinite (but maybe ~100 people you know + everybody else are useful simplifications) Unread flag: nominal, 2 levels (read or unread) Date: quantitative (but maybe ordered is all that matters), infinite (but maybe only ~10 levels matter: today, this week, this month, this year, older) 31
Choosing Visual Variable for Display This information is redundantly coded into visual variables in the display shown above, for better contrast. First, all the fields use position as a variable, since each is assigned to a different column. In addition: Spam: shape, hue, value, size (big colorful icon vs. little dot) Subject: shape Sender: shape Unread: shape, hue, value, size (big green dot vs. little gray dot) and value of entire line (boldface vs. non) Date: shape, size (today is shorter than earlier dates), position (list is sorted by date) 32
Designing Information Display Here’s another example showing how redundant encoding can make an information display easier to scan and easier to use. Search engine results are basically just database records, but they aren’t rendered in a simplistic caption/field display like the one shown on top. Instead, they use rich visual variables – and no field labels! – to enhance the contrast among the items. Page titles convey the most information, so they use size, hue, and value (brightness), plus a little shape (the underline). The summary is in black for good readability, and the URL and size are in green to bracket the summary. 34
Designing Information Display Take a lesson from this: your program’s output displays do not have to be arranged like input forms. When data is self-describing, like names and dates, let it describe itself. And choose good visual variables to enhance the contrast of information that the user needs to see at a glance. 35
Simplicity vs Contrast A case where simplicity is taken too far, and contrast suffers. Simplicity and contrast seem to fight with each other. 36
Contrast Problems . 37
Contrast Problems An example of too little contrast. It’s important to distinguish captions from text fields, but in this design, most of the visual variables are the same for both: - the position is very similar: the box around each caption and text field begins at the same horizontal position. The text itself begins at different positions (left-justified vs. aligned), but it isn’t a strong distinction, and some of the captions fill their column. - the size is the same: captions and text fields fill the same column width - the background hue is slightly different (yellow vs. white), but not easily differentiable 38
Contrast Problems An example of too little contrast. by the squint test - the background value is the same (very bright) - the foreground hue and value are the same (black, plain font) - the orientation is the horizontal, because of course you have to read it. The result is that it’s hard to scan this form. The form is also terribly crowded, which leads us into our next topic… 39
White Spaces Use white space for grouping, instead of lines Use margins to draw eye around design Integrate figure and ground Object should be scaled proportionally to its background Don’t crowd controls together Crowding creates spatial tension and inhibits scanning 40
The Gestalt Principles of Grouping Gestalt principles explain how eye creates a whole (gestalt) from parts 41
The Gestalt Principles of Grouping The power of white space for grouping derives from the Gestalt principle of proximity. These principles, discovered in the 1920’s by the Gestalt school of psychologists, describe how early visual processing groups elements in the visual field into larger wholes. Here are the six principles identified by the Gestalt psychologists: 42
The Gestalt Principles of Grouping Proximity. Elements that are closer to each other are more likely to be grouped together. You see four vertical columns of circles, because the circles are closer vertically than they are horizontally. 43
The Gestalt Principles of Grouping Similarity. Elements with similar attributes are more likely to be grouped. You see four rows of circles in the Similarity example, because the circles are more alike horizontally than they are vertically. 44
The Gestalt Principles of Grouping Continuity. The eye expects to see a contour as a continuous object. You primarily perceive the Continuity example above as two crossing lines, rather than as four lines meeting at a point, or two right angles sharing a vertex. 45
The Gestalt Principles of Grouping Closure. The eye tends to perceive complete, closed figures, even when lines are missing. We see a triangle in the center of the Closure example, even though its edges aren’t complete. 46
The Gestalt Principles of Grouping Area. When two elements overlap, the smaller one will be interpreted as a figure in front of the larger ground. So we tend to perceive the Area example as a small square in front of a large square, rather than a large square with a hole cut in it. 47
The Gestalt Principles of Grouping Symmetry. The eye prefers explanations with greater symmetry. So the Symmetry example is perceived as two overlapping squares, rather than three separate polygons. 48