Download
1 / 28
280 likes | 285 Views
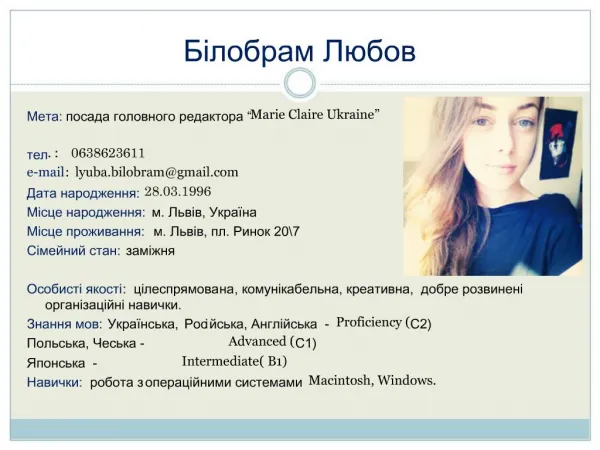
Infographic CV Workshop. Workshop for JCM, JAC and JCC students. Effective Communication with Data Visualization and Design Visual representations of information Charts Maps Icons Progress bars Signs posters Diagrams Online visuals. Infographics.

E N D
Infographic CV Workshop Workshop for JCM, JAC and JCC students
Effective Communication with Data Visualization and Design • Visual representations of information • Charts • Maps • Icons • Progress bars • Signs • posters • Diagrams • Online visuals Infographics
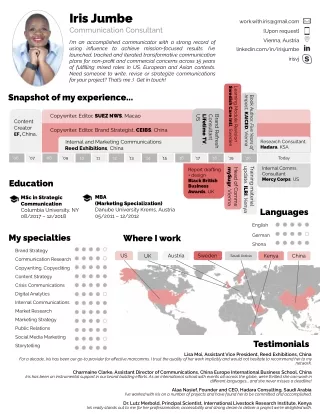
The more strikingly visual your presentation is, the more people will remember it. And more importantly, they will remember you. • Key Benefits • An infographic resume breaks the pattern and draws the reader’s attention. • Data visualization can make the understanding of a candidate’s unique information faster for the reader • The visualized data triggers the reader’s visual memory and the recruiter or hiring manager is more likely to remember that candidate after reviewing many resumes. Infographic Resumes
Poor design • Be visually unappealing • Visualize data incorrectly • Fail to visualize the relevant information • Confuse the reader with too many visualizations • Highlight the wrong attributes for the desired position • Use an inappropriate design tone (such as, a fun, lighthearted design style when applying for a serious role) • Not print correctly if not designed to fit standard paper sizes • Candidates need to identify clearly their key strengths related to the type of positionthey would like to attain. An infographic resume should focus on communicating those key strengths quickly and clearly to the recruiter. Risk
Infographic resume designs should be used to tell the story about job candidates. The story can include their background, history, education, skills, experience, achievements, accomplishments, roles, successes, aspirations, goals, and more. • Most infographic resume designs focus on a combination of these three key types of information: • 1. Timeline of education and work experience • 2. Relative experience and proficiencies among key job skills • 3. Geographic locations Designing an Infographic Resume
Timelines usually highlight an individual’s history related to one or more of the following activities: • Time spent at learning institutions or earning degrees • Time spent working for different companies • Time spent holding different roles or positions • Time spent as a member or volunteer for organizations • Time spent using different software applications • Time spent in different locations • Major events or milestones in a person’s career Timeline Designs
Duncan McKean’s effectively used a large timeline visualization as his entire infographic resume design . Timeline design
Levels of experience in different job skills are normally qualitative and subjective. • Bar charts are the most common visualization to show skills, but there are many other design styles that could also be used. Circle sizes, sliders, bubble charts can also be effective visualizations to display proficiency among multiple skills Relative Experience Designs
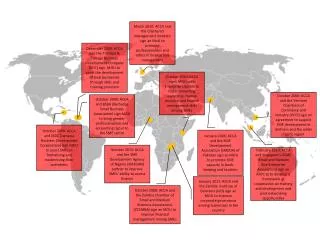
Where a candidate has lived and worked can also be relevant information on a resume. Maps are a common design element to show not only employment locations, but also to visualize length of stay, the sequence of the locations, or the many different countries visited in the course of a career. Geographic Designs
Chris Robertson shows only the relevant states and countries and pinpoints the city locations where he has worked. This saves space and allows Chris to place the locations along a timeline. This design also gave Chris space to include additional information such as his title, the companies he worked for, and a few major client projects. Geographic Designs
One of the easiest and most effective ways to add visual design elements to a resume is by including company logos. Company Logos and Icons
Company logos shown on LinkedIn profiles Company Logos and Icons
Company logos on infographic resume—David Ingram • The logos draw the eye and attention instantly and creates the first impression the resume leaves on the reader. For example, Sony is generally regarded as a company with a tremendously positive reputation, especially related to its training of high-quality employees. Company Logos and Icons
Tina Chen’s resume (Figure 4-15) displays the four different software application icons that she primarily uses for her design work to demonstrate proficiency in each of them. Her other information, like years of experience, foreign language fluency, and the overall design itself are what set Tina apart from other candidates. Software Application Logos
AníbalMaízCáceres’ infographic resume shows the software icons integrated into a relative experience bar chart that shows his varying proficiency level in each application. Aníbal also makes the resume available online in multiple languages (English, Spanish, and French), and the use of icons reduces the amount of text that needs to be translated for each version. Software Application Logos
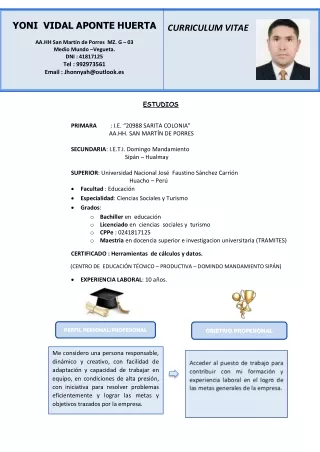
Standalone Infographic Resume (Separate text resume—Mino Parisi) Using an Infographic Resume
Combined Infographic Resume Design • An effective alternative infographic resume format is for the designer to embed individual data visualizations directly into the text resume. The advantage of this design format is that the candidate has only one document that includes both the visual design and the full text Using an Infographic Resume
The design of an infographic resume should be sized to fit the proportions of the page and use a font size big enough to be legible when printed. • In HK, A4-size paper is used (297 × 210 mm, 8.5″ × 11″ letter-size paper) • What kind of printer might be used to print out the resume? • Laser or inkjet? • Color or black and white? • High or low resolution? • If use black and white color printer, please design your infographic resume with five objective in mind: • To be completely black and white, so that it always looked the same when printed • To minimize the file size to make it easy to e-mail and download • To use as little ink as possible when printed out by clients • To be visually distinctive • To contain a large amount of information Designing Infographic Resumes for Print
Most of the infographic resume designs are created manually using common graphic design software, such as Adobe Illustrator or Photoshop. • Microsoft Office is also widely used to create both the individual data visualizations and the overall design. • A number of online services have begun to appear that offer to generate an infographic resume for the user automatically. They all import an individual’s profile information from LinkedIn.com and then enable you to edit or add custom information manually Infographic Resume Design Tools
Vizualize.me • Connect with a LinkedIn account and visualize.me will create an initial resume based on the information it can pull from the profile. Once the initial infographic resume has been created, the user can edit the profile information, choose from a selection of themes, and edit the design options such as colors, backgrounds, fonts, layouts, and more Infographic Resume Design Tools
ResumeUp.com • Login with a LinkedIn account and ResumUP will import the data to create the initial resume. The user has control to edit the information displayed and add information about the type of position and company they are looking for. The final resume is viewable online with a custom URL or can be downloaded as a PDF file. Infographic Resume Design Tools
Desktop Software Tools • Vector Graphics • Adobe Illustrator • Adobe InDesign • Microsoft PowerPoint • Image Editing • Adobe Photoshop • GIMP Design Resource
Online Data Visualization Tools • Chartle.net(www.chartle.com) • normal pie charts, line charts, bar charts, the maps, Venn diagrams, and gauges • DIY Chart(www.diycharts.com) • DIY Chart has a number of chart templates that you can use as the data visualizations in an infographic design. Design Resource
Online Data Visualization Tools • iCharts(www.icharts.net) • iCharts is a neat online tool for creating good charts. You can upload your data set and choose a chart type. A number of different chart types are available and you can customize all the chart attributes or use one of the chart design templates. When you finish, you can download your chart as a PNG image file for use in an infographic design. Design Resource
Online Data Visualization Tools • The Noun Project (www.thenounproject.com) • The Noun Project is a fantastic resource to find icons related to the concepts you need to visualize in your infographic design. Design Resource
infogr.am(infogr.am) (4 steps) • 1. Choose a template. • 2. Add your own data. • 3. Customize the design. • 4. Publish and share. • Piktochart(www.piktochart.com) • Venngage(venngage.com) • Visual.ly(create.visual.ly) • https://www.vecteezy.com/vector-art/89396-free-curriculum-vitae-vector-template Online Infographics Design Sites