Download
1 / 1
10 likes | 182 Views
Liver. GUT. Skin. Patients. PK and PKPD analysis. PK and PD assessments. ACOP 2008. 45. Qualification of an exposure-categorical ordered multi-response population model of inolimomab in graft-versus-host disease.

E N D
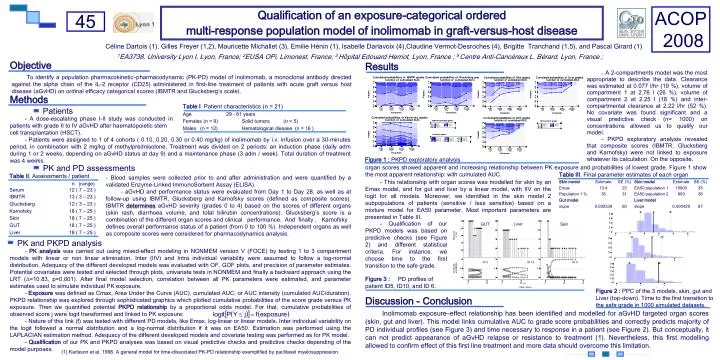
Liver GUT Skin Patients PK and PKPD analysis PK and PD assessments ACOP 2008 45 Qualification of an exposure-categorical ordered multi-response population model of inolimomab in graft-versus-host disease Céline Dartois (1), Gilles Freyer (1,2), Mauricette Michallet (3), Emilie Hénin (1), Isabelle Darlavoix (4),Claudine Vermot-Desroches (4), Brigitte Tranchand (1,5), and Pascal Girard (1) 1EA3738, University Lyon I, Lyon, France; 2EUSA OPi, Limonest, France; 3 Hôpital Edouard Herriot, Lyon, France ; 5Centre Anti-Cancéreux L. Bérard, Lyon, France ; Objective Results - A 2-compartments model was the most appropriate to describe the data. Clearance was estimated at 0.077 l/hr (19 %), volume of compartment 1 at 2.76 l (26 %), volume of compartment 2 at 2.25 l (18 %) and inter-compartmental clearance at 2.22 l/hr (52 %). No covariate was found significant and a visual predictive check (n= 1000) on concentrations allowed us to qualify our model. - PKPD exploratory analysis revealed that composite scores (IBMTR, Glucksberg and Karnofsky) were not linked to exposure whatever its calculation. On the opposite, To identify a population pharmacokinetic–pharmacodynamic (PK-PD) model of inolimomab, a monoclonal antibody directed against the alpha chain of the IL-2 receptor (CD25) administered in first-line treatment of patients with acute graft versus host disease (aGvHD) on ordinal efficacy categorical scores (IBMTR and Glucksberg’s scale). Methods - A dose-escalating phase I-II study was conducted in patients with grade II to IV aGvHD after haematopoietic stem cell transplantation (HSCT). - Patients were assigned to 1 of 4 cohorts ( 0.10, 0.20, 0.30 or 0.40 mg/kg) of inolimomab by i.v. infusion over a 30-minutes period, in combination with 2 mg/kg of methylprednisolone. Treatment was divided on 2 periods: an induction phase (daily adm during 1 or 2 weeks, depending on aGvHD status at day 9) and a maintenance phase (3 adm / week). Total duration of treatment was 4 weeks. Figure 1 : PKPD exploratory analysis organ scores showed apparent and increasing relationship between PK exposure and probabilities of lowest grade. Figure 1 show the most apparent relationship: with cumulated AUC. - Blood samples were collected prior to and after administration and were quantified by a validated Enzyme-Linked ImmunoSorbent Assay (ELISA). - aGvHD and performance status were evaluated from Day 1 to Day 28, as well as at follow-up using IBMTR, Glucksberg and Karnofsky scores (defined as composite scores). IBMTR determinesaGvHD severity (grades 0 to 4) based on the scores of different organs (skin rash, diarrhoea volume, and total bilirubin concentrations). Glucksberg’s score is a combination of the different organ scores and clinical performance. And finally , Karnofsky defines overall performance status of a patient (from 0 to 100 %). Independent organs as well as composite scores were considered for pharmacodynamics analysis. - This relationship with organ scores was modelled for skin by an Emax model, and for gut and liver by a linear model, with IIV on the logit for all models. Moreover, we identified in the skin model 2 subpopulations of patients (sensitive / less sensitive) based on a mixture model for EA50 parameter. Most important parameters are presented in Table III. ; - Qualification of our PKPD models was based on predictive checks (see Figure 2) and different statistical criteria. For instance, we choose time to the first transition to the safe grade. - PK analysis was carried out using mixed-effect modeling in NONMEM version V (FOCE) by testing 1 to 3 compartment models with linear or non linear elimination. Inter (IIV) and Intra individual variability were assumed to follow a log-normal distribution. Adequacy of the different developed models was evaluated with OF, GOF plots, and precision of parameter estimates. Potential covariates were tested and selected through plots, univariate tests in NONMEM and finally a backward approach using the LRT (∆=10.83, p=0.001). After final model selection, correlation between all PK parameters were estimated, and parameter estimates used to simulate individual PK exposure. - Exposure was defined as Cmax, Area Under the Curve (AUC), cumulated AUC, or AUC intensity (cumulated AUC/duration). PKPD relationship was explored through sophisticated graphics which plotted cumulative probabilities of the score grade versus PK exposure. Then we quantified potential PKPD relationship by a proportional odds model. For that, cumulative probabilities of observed score j were logit transformed and linked to PK exposure: - Nature of this link (f) was tested with different PD models, like Emax, log-linear or linear models. Inter individual variability on the logit followed a normal distribution and a log-normal distribution if it was on EA50. Estimation was performed using the LAPLACIAN estimation method. Adequacy of the different developed models and covariate testing was performed as for PK model. - Qualification of our PK and PKPD analyses was based on visual predictive checks and predictive checks depending of the model purposes. Figure 3 : PD profiles of patient ID5, ID10, and ID 6. Figure 2 : PPC of the 3 models, skin, gut and Liver (top-down). Time to the first transition to the safe grade in 1000 simulated datasets. Discussion - Conclusion Inolimomab exposure–effect relationship has been identified and modelled for aGvHD targeted organ scores (skin, gut and liver). This model links cumulative AUC to grade score probabilities and correctly predicts majority of PD individual profiles (see Figure 3) and time necessary to response in a patient (see Figure 2). But conceptually, it can not predict appearance of aGvHD relapse or resistance to treatment (1). Nevertheless, this first modelling allowed to confirm effect of this first line treatment and more data should overcome this limitation. (1) Karlsson et al. 1998. A general model for time-dissociated PK-PD relationship exemplified by paclitaxel myelosuppression.